Join thousands of students who trust us to help them ace their exams!Watch the first video
Multiple Choice
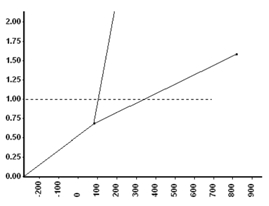
What is the normal freezing point of this unknown substance?
A
0 °C
B
–200 °C
C
200 °C
D
400 °C
E
100 °C
Verified step by step guidance
1
Identify the graph as a phase diagram, which typically shows the relationship between temperature and a property such as pressure or volume for a substance.
Locate the point on the graph where the phase change occurs, which is often indicated by a change in the slope of the line. This is typically where the substance transitions from liquid to solid, known as the freezing point.
Observe the x-axis, which represents temperature, and find the temperature value at the point where the phase change occurs.
Note that the phase change point on the graph is at 100 °C, which is where the line changes slope, indicating the freezing point of the substance.
Conclude that the normal freezing point of the unknown substance is 100 °C, as indicated by the graph and the change in slope at this temperature.