Here are the essential concepts you must grasp in order to answer the question correctly.
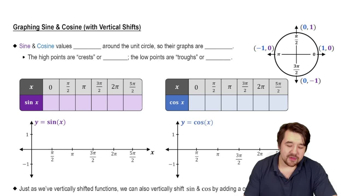
Function Graphing
Graphing a function involves plotting points on a coordinate system that represent the output values of the function for given input values. Understanding how to read and interpret the graph of a function, including its shape, intercepts, and asymptotes, is essential for visualizing its behavior and characteristics.
Recommended video:
Graph of Sine and Cosine Function
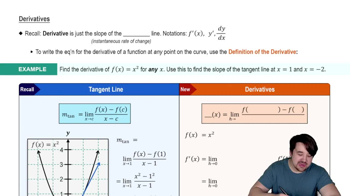
Derivative
The derivative of a function, denoted as f', represents the rate of change of the function with respect to its variable. It provides information about the slope of the tangent line to the graph of the function at any given point, indicating where the function is increasing or decreasing and identifying critical points such as maxima and minima.
Recommended video:
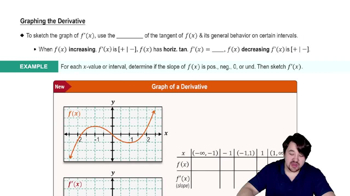
Graphing Derivatives
Plotting the graph of a derivative function involves representing the slopes of the original function at various points. This graph can reveal important features of the original function, such as intervals of increase and decrease, as well as points of inflection where the concavity changes. Understanding how to relate the original function's graph to its derivative is crucial for comprehensive analysis.
Recommended video: