Here are the essential concepts you must grasp in order to answer the question correctly.
Function and Derivative Relationship
The derivative of a function measures the rate at which the function's value changes as its input changes. Graphically, the derivative represents the slope of the tangent line to the function's graph at any given point. Understanding this relationship is crucial for matching functions with their derivatives, as the behavior of the function (increasing, decreasing, or constant) directly influences the shape of its derivative graph.
Recommended video:
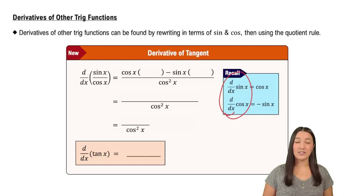
Derivatives of Other Trig Functions
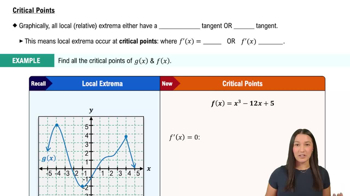
Critical Points
Critical points occur where the derivative of a function is zero or undefined. These points are significant because they indicate potential local maxima, minima, or points of inflection on the function's graph. Identifying critical points helps in understanding the overall behavior of the function and is essential for accurately matching it with its derivative, as the derivative graph will show changes in sign at these points.
Recommended video:
Graphical Interpretation of Derivatives
The graphical interpretation of derivatives involves analyzing how the slope of the function changes across its domain. For instance, where the function is increasing, the derivative will be positive, and where it is decreasing, the derivative will be negative. Additionally, the points where the derivative crosses the x-axis correspond to the critical points of the original function, making it vital to recognize these patterns when matching graphs.
Recommended video:
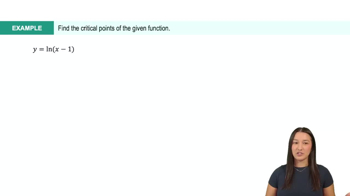
Graphical Applications of Exponential & Logarithmic Derivatives: Example 8