Textbook Question
Use the graph of in the figure to find the following values or state that they do not exist. <IMAGE>
 Verified step by step guidanceVerified video answer for a similar problem:
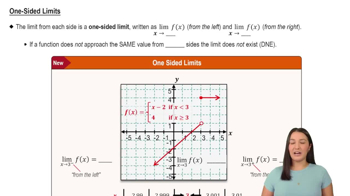
 05:50
05:50 05:34
05:34 06:15
06:15 6:47m
6:47mMaster Finding Limits Numerically and Graphically with a bite sized video explanation from Patrick
Start learning