Given the function f(x)=−16x2+64x, complete the following. <IMAGE> Find the slopes of the secant lines that pass though the points (x,f(x)) and (2,f(2)), for x=1.5,1.9,1.99,1.999, and 1.9999 (see figure).
Verified step by step guidance
1
First, evaluate the function f(x) at the given point x = 2. Substitute x = 2 into the function f(x) = -16x^2 + 64x to find f(2).
Next, evaluate the function f(x) at each of the specified x-values: x = 1.5, 1.9, 1.99, 1.999, and 1.9999. Substitute each x-value into the function to find f(x) for each case.
For each x-value, calculate the slope of the secant line that passes through the points (x, f(x)) and (2, f(2)). Use the formula for the slope of a secant line: m = (f(x) - f(2)) / (x - 2).
Substitute the values of f(x) and f(2) into the slope formula for each x-value to find the slope of the secant line.
Repeat the calculation for each x-value to determine the slopes of the secant lines for x = 1.5, 1.9, 1.99, 1.999, and 1.9999.
Verified video answer for a similar problem:
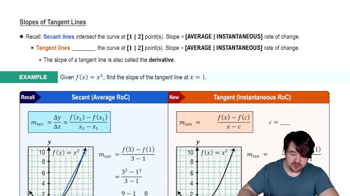
This video solution was recommended by our tutors as helpful for the problem above
Video duration:
7m
Play a video:
Was this helpful?
Key Concepts
Here are the essential concepts you must grasp in order to answer the question correctly.
Secant Line
A secant line is a straight line that intersects a curve at two or more points. In calculus, it is often used to approximate the slope of the curve between those points. The slope of the secant line can be calculated using the formula (f(b) - f(a)) / (b - a), where a and b are the x-coordinates of the points of intersection.
The slope of a function at a given point represents the rate of change of the function's value with respect to changes in the input variable. It is calculated as the derivative of the function at that point. For secant lines, the slope provides an average rate of change between two points, while the derivative gives the instantaneous rate of change at a specific point.
A quadratic function is a polynomial function of degree two, typically expressed in the form f(x) = ax^2 + bx + c. The graph of a quadratic function is a parabola, which can open upwards or downwards depending on the sign of the coefficient 'a'. Understanding the properties of quadratic functions, such as their vertex and axis of symmetry, is essential for analyzing their behavior and calculating slopes.