Use the graph of f in the figure to evaluate the function or analyze the limit. <IMAGE> lim x→3^+ f(x)
Verified step by step guidance
1
Identify the behavior of the function \( f(x) \) as \( x \) approaches 3 from the right (denoted as \( x \to 3^+ \)).
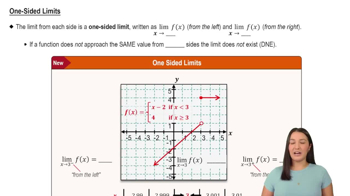
Examine the graph of \( f(x) \) to observe the values of \( f(x) \) as \( x \) gets closer to 3 from values greater than 3.
Look for any discontinuities, jumps, or asymptotic behavior near \( x = 3 \) to understand how \( f(x) \) behaves.
Determine the value that \( f(x) \) approaches as \( x \to 3^+ \) by observing the trend on the graph.
Conclude the limit \( \lim_{x \to 3^+} f(x) \) based on the observed behavior of the function on the graph.
Verified video answer for a similar problem:
This video solution was recommended by our tutors as helpful for the problem above
Video duration:
2m
Play a video:
Was this helpful?
Key Concepts
Here are the essential concepts you must grasp in order to answer the question correctly.
Limits
A limit is a fundamental concept in calculus that describes the behavior of a function as its input approaches a certain value. In this case, we are interested in the limit of f(x) as x approaches 3 from the right (denoted as x→3^+). Understanding limits helps in analyzing the continuity and behavior of functions at specific points.
One-sided limits refer to the value that a function approaches as the input approaches a specific point from one side only. The notation x→3^+ indicates that we are looking at values of x that are greater than 3. This is crucial for determining the behavior of f(x) near x = 3, especially if the function has different behaviors from the left and right.
Graphical analysis involves interpreting the visual representation of a function to understand its properties, such as limits, continuity, and discontinuities. By examining the graph of f near x = 3, one can determine the value of the limit as x approaches 3 from the right, which is essential for solving the given problem.