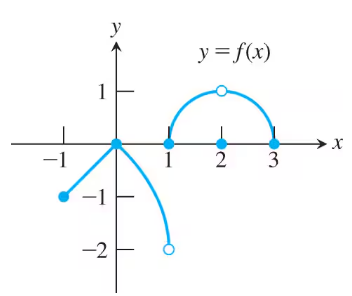
Which of the following statements about the function y=f(x) graphed here are true, and which are false?
b. limx→2 f(x)=2
Verified step by step guidance
1
Step 1: Understand the concept of a limit. The limit of a function as x approaches a certain value is the value that the function approaches as x gets closer to that value.
Step 2: Examine the graph of the function y = f(x) near x = 2. Look at the behavior of the function as x approaches 2 from both the left and the right.
Step 3: Determine if the function approaches the value 2 as x approaches 2. This involves checking if the y-values of the function are getting closer to 2 as x gets closer to 2 from both sides.
Step 4: Consider any discontinuities or jumps in the graph at x = 2. If the function does not approach the same value from both sides, the limit does not exist.
Step 5: Conclude whether the statement limx→2 f(x)=2 is true or false based on your observations of the graph. If the function approaches 2 from both sides, the statement is true; otherwise, it is false.
Verified video answer for a similar problem:
This video solution was recommended by our tutors as helpful for the problem above
Video duration:
4m
Play a video:
Was this helpful?
Key Concepts
Here are the essential concepts you must grasp in order to answer the question correctly.
Limits
A limit is a fundamental concept in calculus that describes the behavior of a function as its input approaches a certain value. It helps determine the value that a function approaches, which may not necessarily be the function's value at that point. For example, if we say lim x→2 f(x) = 2, it means that as x gets closer to 2, the function f(x) approaches the value 2.
A function is continuous at a point if the limit of the function as it approaches that point equals the function's value at that point. This means there are no breaks, jumps, or holes in the graph of the function at that point. Understanding continuity is essential for evaluating limits and determining the validity of statements regarding function behavior.
Interpreting a graph involves analyzing the visual representation of a function to extract information about its behavior, such as limits, continuity, and points of interest. By examining the graph, one can determine whether the limit statement provided is true or false based on the function's behavior as it approaches the specified value.