Show that the line y = mx + b is its own tangent line at any point (x₀, mx₀ + b).
Table of contents
- 0. Functions7h 55m
- Introduction to Functions18m
- Piecewise Functions10m
- Properties of Functions9m
- Common Functions1h 8m
- Transformations5m
- Combining Functions27m
- Exponent rules32m
- Exponential Functions28m
- Logarithmic Functions24m
- Properties of Logarithms36m
- Exponential & Logarithmic Equations35m
- Introduction to Trigonometric Functions38m
- Graphs of Trigonometric Functions44m
- Trigonometric Identities47m
- Inverse Trigonometric Functions48m
- 1. Limits and Continuity2h 2m
- 2. Intro to Derivatives1h 33m
- 3. Techniques of Differentiation3h 18m
- 4. Applications of Derivatives2h 38m
- 5. Graphical Applications of Derivatives6h 2m
- 6. Derivatives of Inverse, Exponential, & Logarithmic Functions2h 37m
- 7. Antiderivatives & Indefinite Integrals1h 26m
- 8. Definite Integrals4h 44m
- 9. Graphical Applications of Integrals2h 27m
- 10. Physics Applications of Integrals 3h 16m
- 11. Integrals of Inverse, Exponential, & Logarithmic Functions2h 31m
- 12. Techniques of Integration7h 41m
- 13. Intro to Differential Equations2h 55m
- 14. Sequences & Series5h 36m
- 15. Power Series2h 19m
- 16. Parametric Equations & Polar Coordinates7h 58m
2. Intro to Derivatives
Tangent Lines and Derivatives
Problem 3.1.1
Textbook Question
Slopes and Tangent Lines
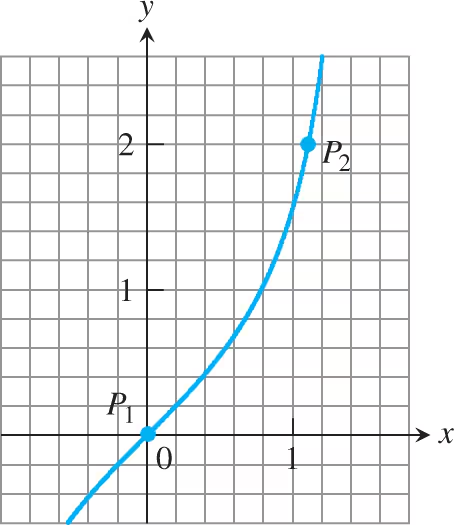
In Exercises 1–4, use the grid and a straight edge to make a rough estimate of the slope of the curve (in y-units per x-unit) at the points P₁ and P₂.

 Verified step by step guidance
1
To estimate the slope of the curve at point P₁, first identify the coordinates of P₁ on the graph. It appears that P₁ is at (0, 0).
Next, draw a tangent line at point P₁ using a straight edge. The tangent line should just touch the curve at P₁ without crossing it.
Estimate the slope of the tangent line at P₁ by choosing two points on the tangent line. Calculate the rise over run (change in y over change in x) between these two points.
Repeat the process for point P₂. Identify the coordinates of P₂, which appear to be approximately (1, 2) on the graph.
Draw a tangent line at point P₂ using a straight edge. Estimate the slope of this tangent line by selecting two points on it and calculating the rise over run.
 Verified video answer for a similar problem:
This video solution was recommended by our tutors as helpful for the problem above
Video duration:
2mPlay a video:
0 Comments
Key Concepts
Here are the essential concepts you must grasp in order to answer the question correctly.
Slope of a Curve
The slope of a curve at a given point represents the rate of change of the function at that point. It is calculated as the ratio of the vertical change (rise) to the horizontal change (run) between two points on the curve. For a smooth curve, this slope can be approximated by drawing a tangent line at the point of interest.
Recommended video:

Understanding Slope Fields
Tangent Line
A tangent line to a curve at a specific point is a straight line that touches the curve at that point without crossing it. The slope of the tangent line at that point is equal to the derivative of the function at that point, providing a linear approximation of the curve's behavior nearby.
Recommended video:

Slopes of Tangent Lines
Estimating Slopes
Estimating slopes involves visually analyzing the graph to determine the steepness of the curve at specific points. This can be done by selecting two points close to the point of interest and calculating the slope of the line connecting them, or by drawing a tangent line and measuring its slope. This estimation is crucial for understanding the function's behavior in calculus.
Recommended video:

Understanding Slope Fields

 5:13m
5:13mWatch next
Master Slopes of Tangent Lines with a bite sized video explanation from Patrick
Start learningRelated Videos
Related Practice
Textbook Question
