Here are the essential concepts you must grasp in order to answer the question correctly.
Derivative and Critical Points
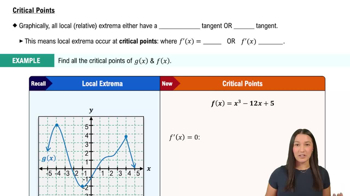
The derivative of a function, denoted as y' or f'(x), represents the rate of change of the function at any point. Critical points occur where the derivative is zero or undefined, indicating potential locations for local maxima, minima, or points of inflection. Analyzing these points helps determine the behavior of the function around them.
Recommended video:
Sign Chart Analysis
A sign chart is a visual tool used to determine the intervals where a function's derivative is positive, negative, or zero. By evaluating the sign of the derivative around critical points, one can infer whether the function is increasing or decreasing, which aids in identifying local maxima and minima, as well as points of inflection.
Recommended video:
Derivatives Applied To Acceleration Example 2
Local Extrema and Points of Inflection
Local extrema refer to points where a function reaches a local maximum or minimum, determined by the sign of the derivative. A point of inflection occurs where the concavity of the function changes, typically identified by a change in the sign of the second derivative. Understanding these concepts is crucial for analyzing the overall shape and behavior of the graph of the function.
Recommended video: