Sketch a graph of a function f with the following properties.
f' < 0 and f" < 0, for 8 < x < 10
Verified step by step guidance
1
Understand the given conditions: f'(x) < 0 means the function f is decreasing in the interval 8 < x < 10, and f''(x) < 0 means the function is concave down in the same interval.
Visualize the behavior of the function: Since f'(x) < 0, the slope of the tangent line to the graph of f is negative, indicating that the graph is sloping downward. Additionally, f''(x) < 0 implies that the graph is curving downward, resembling a 'downward bowl' shape.
Sketch the graph in the interval 8 < x < 10: Start by drawing a curve that decreases (slopes downward) and is concave down. Ensure the curve does not flatten or change concavity within this interval.
Consider the behavior outside the interval: While the problem does not specify the behavior of f for x ≤ 8 or x ≥ 10, ensure the graph transitions smoothly into the interval 8 < x < 10 without abrupt changes.
Label the graph appropriately: Mark the interval 8 < x < 10 on the x-axis and ensure the graph clearly reflects the properties f'(x) < 0 and f''(x) < 0 within this interval.
Verified video answer for a similar problem:
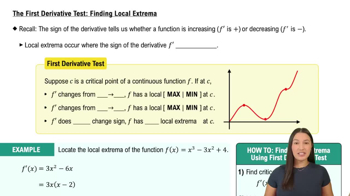
This video solution was recommended by our tutors as helpful for the problem above
Video duration:
2m
Play a video:
Was this helpful?
Key Concepts
Here are the essential concepts you must grasp in order to answer the question correctly.
First Derivative Test
The first derivative of a function, denoted as f', indicates the slope of the tangent line to the graph at any point. If f' < 0, the function is decreasing in that interval. Understanding this concept is crucial for sketching the graph, as it informs us that the function is moving downward between x = 8 and x = 10.
The second derivative, denoted as f'', provides information about the concavity of the function. If f'' < 0, the function is concave down, meaning that the slope of the tangent line is decreasing. This concept is essential for sketching the graph, as it indicates that the function not only decreases but does so at an accelerating rate in the specified interval.
Understanding the overall behavior of a function based on its derivatives is key to sketching its graph. In this case, since f' < 0 and f'' < 0 for 8 < x < 10, the graph will show a downward slope that becomes steeper as x increases. This behavior helps in accurately representing the function's characteristics in the specified interval.