Here are the essential concepts you must grasp in order to answer the question correctly.
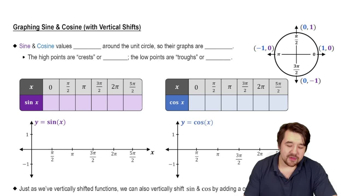
Graphing Functions
Graphing functions involves plotting points on a coordinate plane to visualize the relationship between the input (x-values) and output (y-values) of a function. For the functions ƒ₁(x) = x³ and ƒ₂(x) = |x³|, understanding how to graph polynomial and absolute value functions is essential. The graph of ƒ₁ will show a cubic curve, while ƒ₂ will reflect any negative values of ƒ₁ above the x-axis.
Recommended video:
Graph of Sine and Cosine Function
Absolute Value Function
The absolute value function, denoted as |x|, transforms any negative input into a positive output while leaving positive inputs unchanged. In the context of ƒ₂(x) = |x³|, this means that all negative values of x³ will be reflected above the x-axis, resulting in a graph that is symmetric with respect to the y-axis for the negative x-values. This transformation alters the shape of the graph significantly.
Recommended video:
Average Value of a Function
Effect of Transformations on Graphs
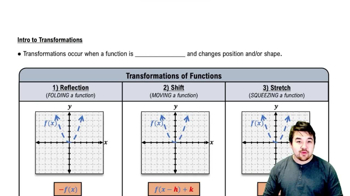
Transformations in calculus refer to changes made to the graph of a function, such as reflections, translations, or stretches. Applying the absolute value function to ƒ₁(x) = x³ results in a reflection of the portions of the graph that lie below the x-axis, effectively changing the overall shape of the graph. This concept is crucial for understanding how different functions can be manipulated and how their graphs can be interpreted.
Recommended video: