Here are the essential concepts you must grasp in order to answer the question correctly.
Graphing Functions
Graphing functions involves plotting points on a coordinate plane to visualize the relationship between the input (x-values) and output (y-values) of a function. For the functions ƒ₁(x) = x² and ƒ₂(x) = |x|², understanding their shapes is crucial. ƒ₁ is a standard parabola opening upwards, while ƒ₂, due to the absolute value, also forms a parabola but reflects any negative x-values to positive, ensuring all outputs are non-negative.
Recommended video:
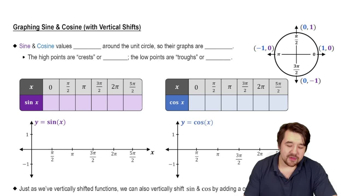
Graph of Sine and Cosine Function
Absolute Value Function
The absolute value function, denoted as |x|, transforms any negative input into its positive counterpart. This means that for the function ƒ₂(x) = |x|², the output is always non-negative, regardless of whether x is positive or negative. This property affects the graph by ensuring that all points lie above the x-axis, creating a symmetric shape about the y-axis.
Recommended video:
Average Value of a Function
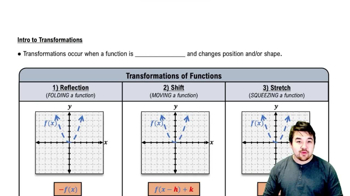
Transformation of Graphs
Transformations of graphs refer to changes made to the original function that affect its position or shape. In this case, applying the absolute value to ƒ₁(x) = x² to create ƒ₂(x) = |x|² results in a graph that retains the parabolic shape of ƒ₁ but modifies it to reflect any negative portions of the graph upwards. This transformation emphasizes the non-negativity of the output values, altering the visual representation of the function.
Recommended video: