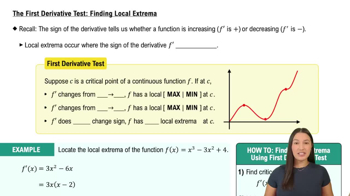
Here are the essential concepts you must grasp in order to answer the question correctly.
Graphing Functions
Graphing functions involves plotting the set of points that satisfy the function's equation on a coordinate plane. For the function y = x^(2/3) + (x-1)^(2/3), understanding its shape and behavior requires identifying key features such as intercepts, symmetry, and any asymptotic behavior. This visual representation helps in analyzing the function's overall behavior and any critical points.
Recommended video:
Graph of Sine and Cosine Function
First Derivative
The first derivative of a function, denoted as f'(x), provides information about the function's rate of change and can be used to determine intervals of increase or decrease. For y = x^(2/3) + (x-1)^(2/3), calculating the first derivative helps identify critical points where the slope is zero or undefined, indicating potential local maxima, minima, or points of inflection.
Recommended video:
The First Derivative Test: Finding Local Extrema
Critical Points and Behavior Analysis
Critical points occur where the first derivative is zero or undefined, indicating potential changes in the function's behavior. Analyzing these points for y = x^(2/3) + (x-1)^(2/3) helps determine where the function changes from increasing to decreasing or vice versa. This analysis is crucial for understanding the graph's shape and identifying any local extrema or inflection points.
Recommended video: