

 5:53
5:53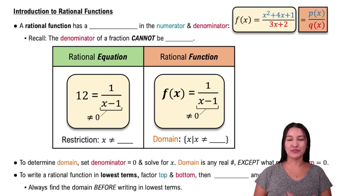

Textbook Question
Theory and Examples
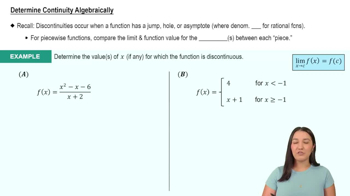
The accompanying figure shows a rectangle inscribed in an isosceles right triangle whose hypotenuse is 2 units long.
a. Express the y-coordinate of P in terms of x. (You might start by writing an equation for the line AB.)
<IMAGE>