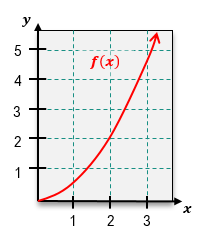
Join thousands of students who trust us to help them ace their exams!Watch the first video
Multiple Choice
Use two rectangles to estimate the area under the curve of from to using left endpoints.
A
B
C
D
Verified step by step guidance
1
First, identify the function given: \( f(x) = \frac{1}{2}x^2 \). We need to estimate the area under this curve from \( x = 0 \) to \( x = 3 \) using two rectangles and left endpoints.
Divide the interval \([0, 3]\) into two equal subintervals. Each subinterval will have a width of \( \Delta x = \frac{3 - 0}{2} = 1.5 \).
For the first rectangle, use the left endpoint of the first subinterval, which is \( x = 0 \). Calculate the height of the rectangle using \( f(0) = \frac{1}{2}(0)^2 = 0 \). The area of the first rectangle is \( \text{height} \times \text{width} = 0 \times 1.5 = 0 \).
For the second rectangle, use the left endpoint of the second subinterval, which is \( x = 1.5 \). Calculate the height of the rectangle using \( f(1.5) = \frac{1}{2}(1.5)^2 = \frac{1}{2} \times 2.25 = 1.125 \). The area of the second rectangle is \( 1.125 \times 1.5 = 1.6875 \).
Add the areas of the two rectangles to estimate the total area under the curve: \( 0 + 1.6875 = 1.6875 \). This is the estimated area using two rectangles with left endpoints.