Here are the essential concepts you must grasp in order to answer the question correctly.
Asymptotes
Asymptotes are lines that a graph approaches but never touches. Vertical asymptotes occur where a function approaches infinity, typically at points where the function is undefined. Horizontal asymptotes indicate the behavior of a function as x approaches infinity or negative infinity, showing the value the function approaches. Understanding asymptotes is crucial for sketching the overall behavior of a function.
Recommended video:
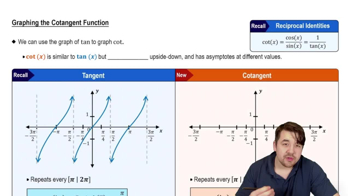
Introduction to Cotangent Graph
Limits
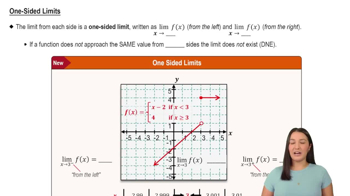
Limits describe the behavior of a function as the input approaches a certain value. They are fundamental in calculus for defining continuity, derivatives, and integrals. In this context, limits at infinity help determine the horizontal asymptotes of the function, indicating the values the function approaches as x becomes very large or very small. Mastery of limits is essential for analyzing function behavior.
Recommended video:
Function Values
Function values at specific points provide critical information about the graph of a function. For instance, knowing that f(-1) = -2, f(0) = 0, and f(1) = 2 allows us to plot key points on the graph. These values help in understanding the function's behavior in different intervals and are essential for sketching the graph accurately. They also assist in identifying local maxima, minima, and points of intersection.
Recommended video:
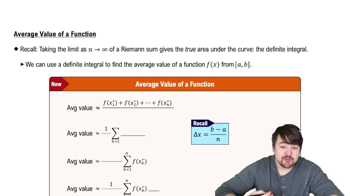
Average Value of a Function