
Textbook Question
Finding Derivative Functions and Values
Using the definition, calculate the derivatives of the functions in Exercises 1–6. Then find the values of the derivatives as specified.
g(t) = 1/t²; g′(−1), g′(2), g′(√3)
 Verified step by step guidanceVerified video answer for a similar problem:
 5:53
5:53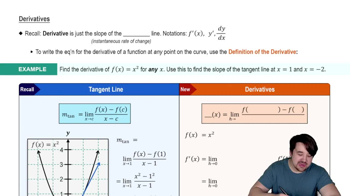 05:44
05:44 05:23
05:23