Here are the essential concepts you must grasp in order to answer the question correctly.
Asymptotes
Asymptotes are lines that a graph approaches but never touches. They can be vertical, horizontal, or oblique. Vertical asymptotes occur where a function approaches infinity, typically at points where the denominator is zero. Horizontal asymptotes indicate the behavior of a function as x approaches infinity or negative infinity, showing the function's end behavior.
Recommended video:
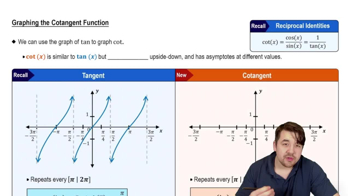
Introduction to Cotangent Graph
Graphing Rational Functions
Graphing rational functions involves plotting the function, which is a ratio of two polynomials. Key steps include identifying intercepts, asymptotes, and the overall shape of the graph. Understanding the behavior near asymptotes and the end behavior of the function is crucial for accurate representation. A graphing utility can assist in visualizing these features, but manual sketching helps correct any inaccuracies.
Recommended video:
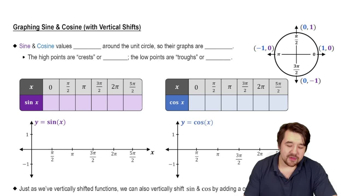
Graph of Sine and Cosine Function
End Behavior of Functions
The end behavior of a function describes how the function behaves as the input values approach positive or negative infinity. For rational functions, this behavior is influenced by the degrees of the numerator and denominator polynomials. Analyzing the leading coefficients and degrees helps predict whether the function will approach a finite value, infinity, or negative infinity, which is essential for sketching accurate graphs.
Recommended video:
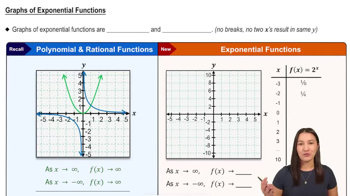
Graphs of Exponential Functions