Table of contents
- 1. Intro to Stats and Collecting Data(0)
- 2. Describing Data with Tables and Graphs(0)
- 3. Describing Data Numerically(0)
- 4. Probability(0)
- 5. Binomial Distribution & Discrete Random Variables(0)
- 6. Normal Distribution and Continuous Random Variables(0)
- 7. Sampling Distributions & Confidence Intervals: Mean(0)
- Sampling Distribution of the Sample Mean and Central Limit Theorem(0)
- Distribution of Sample Mean - Excel(0)
- Introduction to Confidence Intervals(0)
- Confidence Intervals for Population Mean(0)
- Determining the Minimum Sample Size Required(0)
- Finding Probabilities and T Critical Values - Excel(0)
- Confidence Intervals for Population Means - Excel(0)
- 8. Sampling Distributions & Confidence Intervals: Proportion(0)
- 9. Hypothesis Testing for One Sample(0)
- Steps in Hypothesis Testing(0)
- Performing Hypothesis Tests: Means(0)
- Hypothesis Testing: Means - Excel(0)
- Performing Hypothesis Tests: Proportions(0)
- Hypothesis Testing: Proportions - Excel(0)
- Performing Hypothesis Tests: Variance(0)
- Critical Values and Rejection Regions(0)
- Link Between Confidence Intervals and Hypothesis Testing(0)
- Type I & Type II Errors(0)
- 10. Hypothesis Testing for Two Samples(0)
- Two Proportions(0)
- Two Proportions Hypothesis Test - Excel(0)
- Two Means - Unknown, Unequal Variance(0)
- Two Means - Unknown Variances Hypothesis Test - Excel(0)
- Two Means - Unknown, Equal Variance(0)
- Two Means - Unknown, Equal Variances Hypothesis Test - Excel(0)
- Two Means - Known Variance(0)
- Two Means - Sigma Known Hypothesis Test - Excel(0)
- Two Means - Matched Pairs (Dependent Samples)(0)
- Matched Pairs Hypothesis Test - Excel(0)
- Two Variances and F Distribution(0)
- Two Variances - Graphing Calculator(0)
- 11. Correlation(0)
- 12. Regression(0)
- Linear Regression & Least Squares Method(0)
- Residuals(0)
- Coefficient of Determination(0)
- Regression Line Equation and Coefficient of Determination - Excel(0)
- Finding Residuals and Creating Residual Plots - Excel(0)
- Inferences for Slope(0)
- Enabling Data Analysis Toolpak(0)
- Regression Readout of the Data Analysis Toolpak - Excel(0)
- Prediction Intervals(0)
- Prediction Intervals - Excel(0)
- Multiple Regression - Excel(0)
- Quadratic Regression(0)
- Quadratic Regression - Excel(0)
- 13. Chi-Square Tests & Goodness of Fit(0)
- 14. ANOVA(0)
1. Intro to Stats and Collecting Data
Intro to Stats
1. Intro to Stats and Collecting Data
Intro to Stats: Videos & Practice Problems
118 of 0
Problem 118Multiple Choice
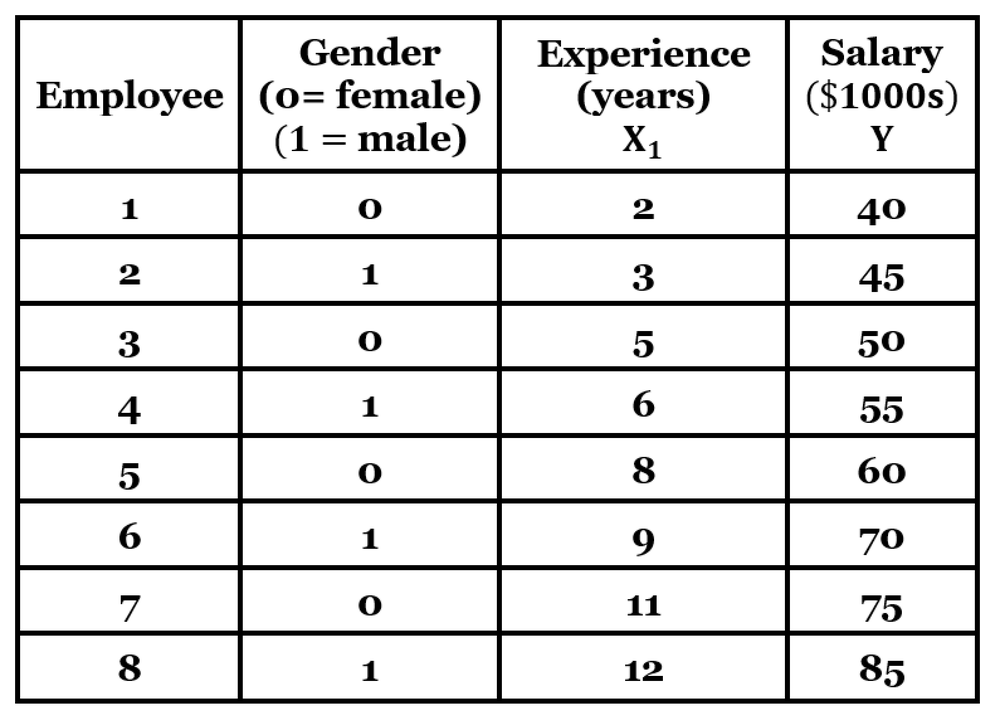
Refer to the dataset "Employee Salary Analysis" given below. The dataset includes employee gender, years of experience, and annual salary. For gender, let 0 represent female and 1 represent male.

i. Using salary as the response variable, determine the multiple regression equation using variable experience and the dummy variable for gender.
Then, use the equation to predict the salary for an employee with the characteristics given below:
Female employee with 10 years of experience
Male employee with 10 years of experience
ii. Does gender appear to have a significant effect on salary?
0 Comments