Table of contents
- 1. Intro to Stats and Collecting Data(0)
- 2. Describing Data with Tables and Graphs(0)
- 3. Describing Data Numerically(0)
- 4. Probability(0)
- 5. Binomial Distribution & Discrete Random Variables(0)
- 6. Normal Distribution and Continuous Random Variables(0)
- 7. Sampling Distributions & Confidence Intervals: Mean(0)
- Sampling Distribution of the Sample Mean and Central Limit Theorem(0)
- Distribution of Sample Mean - Excel(0)
- Introduction to Confidence Intervals(0)
- Confidence Intervals for Population Mean(0)
- Determining the Minimum Sample Size Required(0)
- Finding Probabilities and T Critical Values - Excel(0)
- Confidence Intervals for Population Means - Excel(0)
- 8. Sampling Distributions & Confidence Intervals: Proportion(0)
- 9. Hypothesis Testing for One Sample(0)
- Steps in Hypothesis Testing(0)
- Performing Hypothesis Tests: Means(0)
- Hypothesis Testing: Means - Excel(0)
- Performing Hypothesis Tests: Proportions(0)
- Hypothesis Testing: Proportions - Excel(0)
- Performing Hypothesis Tests: Variance(0)
- Critical Values and Rejection Regions(0)
- Link Between Confidence Intervals and Hypothesis Testing(0)
- Type I & Type II Errors(0)
- 10. Hypothesis Testing for Two Samples(0)
- Two Proportions(0)
- Two Proportions Hypothesis Test - Excel(0)
- Two Means - Unknown, Unequal Variance(0)
- Two Means - Unknown Variances Hypothesis Test - Excel(0)
- Two Means - Unknown, Equal Variance(0)
- Two Means - Unknown, Equal Variances Hypothesis Test - Excel(0)
- Two Means - Known Variance(0)
- Two Means - Sigma Known Hypothesis Test - Excel(0)
- Two Means - Matched Pairs (Dependent Samples)(0)
- Matched Pairs Hypothesis Test - Excel(0)
- Two Variances and F Distribution(0)
- Two Variances - Graphing Calculator(0)
- 11. Correlation(0)
- 12. Regression(0)
- Linear Regression & Least Squares Method(0)
- Residuals(0)
- Coefficient of Determination(0)
- Regression Line Equation and Coefficient of Determination - Excel(0)
- Finding Residuals and Creating Residual Plots - Excel(0)
- Inferences for Slope(0)
- Enabling Data Analysis Toolpak(0)
- Regression Readout of the Data Analysis Toolpak - Excel(0)
- Prediction Intervals(0)
- Prediction Intervals - Excel(0)
- Multiple Regression - Excel(0)
- Quadratic Regression(0)
- Quadratic Regression - Excel(0)
- 13. Chi-Square Tests & Goodness of Fit(0)
- 14. ANOVA(0)
1. Intro to Stats and Collecting Data
Intro to Stats
1. Intro to Stats and Collecting Data
Intro to Stats: Videos & Practice Problems

143 of 0
Problem 143Multiple Choice
Use the following control chart, which results from the temperature deviation data for 25 consecutive batches, each containing 40 newly manufactured thermometers.
The thermometers must meet strict accuracy standards. The recorded values represent temperature deviations (in °C) from a calibrated reference under controlled conditions. Industry regulations require that deviations remain within ±1.5 °C.
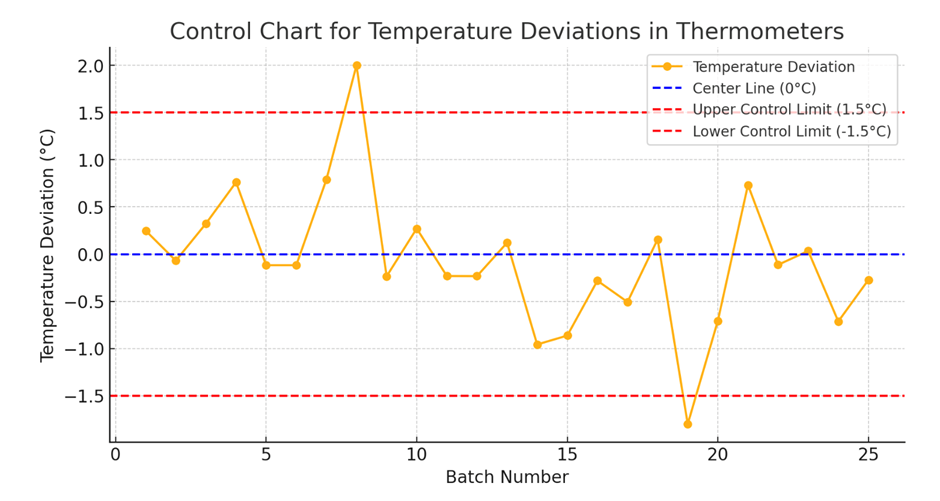
Is the process within statistical control? Why or why not?
0 Comments