Table of contents
- 1. Intro to Stats and Collecting Data(0)
- 2. Describing Data with Tables and Graphs(0)
- 3. Describing Data Numerically(0)
- 4. Probability(0)
- 5. Binomial Distribution & Discrete Random Variables(0)
- 6. Normal Distribution and Continuous Random Variables(0)
- 7. Sampling Distributions & Confidence Intervals: Mean(0)
- Sampling Distribution of the Sample Mean and Central Limit Theorem(0)
- Distribution of Sample Mean - Excel(0)
- Introduction to Confidence Intervals(0)
- Confidence Intervals for Population Mean(0)
- Determining the Minimum Sample Size Required(0)
- Finding Probabilities and T Critical Values - Excel(0)
- Confidence Intervals for Population Means - Excel(0)
- 8. Sampling Distributions & Confidence Intervals: Proportion(0)
- 9. Hypothesis Testing for One Sample(0)
- Steps in Hypothesis Testing(0)
- Performing Hypothesis Tests: Means(0)
- Hypothesis Testing: Means - Excel(0)
- Performing Hypothesis Tests: Proportions(0)
- Hypothesis Testing: Proportions - Excel(0)
- Performing Hypothesis Tests: Variance(0)
- Critical Values and Rejection Regions(0)
- Link Between Confidence Intervals and Hypothesis Testing(0)
- Type I & Type II Errors(0)
- 10. Hypothesis Testing for Two Samples(0)
- Two Proportions(0)
- Two Proportions Hypothesis Test - Excel(0)
- Two Means - Unknown, Unequal Variance(0)
- Two Means - Unknown Variances Hypothesis Test - Excel(0)
- Two Means - Unknown, Equal Variance(0)
- Two Means - Unknown, Equal Variances Hypothesis Test - Excel(0)
- Two Means - Known Variance(0)
- Two Means - Sigma Known Hypothesis Test - Excel(0)
- Two Means - Matched Pairs (Dependent Samples)(0)
- Matched Pairs Hypothesis Test - Excel(0)
- Two Variances and F Distribution(0)
- Two Variances - Graphing Calculator(0)
- 11. Correlation(0)
- 12. Regression(0)
- Linear Regression & Least Squares Method(0)
- Residuals(0)
- Coefficient of Determination(0)
- Regression Line Equation and Coefficient of Determination - Excel(0)
- Finding Residuals and Creating Residual Plots - Excel(0)
- Inferences for Slope(0)
- Enabling Data Analysis Toolpak(0)
- Regression Readout of the Data Analysis Toolpak - Excel(0)
- Prediction Intervals(0)
- Prediction Intervals - Excel(0)
- Multiple Regression - Excel(0)
- Quadratic Regression(0)
- Quadratic Regression - Excel(0)
- 13. Chi-Square Tests & Goodness of Fit(0)
- 14. ANOVA(0)
9. Hypothesis Testing for One Sample
Steps in Hypothesis Testing
9. Hypothesis Testing for One Sample
Steps in Hypothesis Testing: Videos & Practice Problems
135 of 0
Problem 135Multiple Choice
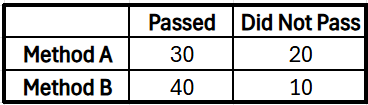
A school conducted an experiment to compare the proportion of students who passed a short quiz after using two different study methods. The results are summarized in the table below.

Using this data, conduct a test for independence using a contingency table and a two-proportion -test to compare the two groups. Then, show how the two test statistics are related by verifying that . Also, demonstrate that the critical values from both tests have the same squared relationship. Use a significance level for both tests.
0 Comments