


Open Question
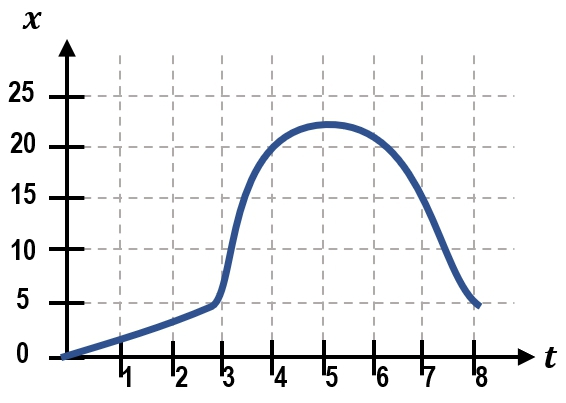
FIGURE EX1.18 shows the motion diagram of a drag racer. The camera took one frame every 2 s. (b) Make a position-versus-time graph for the drag racer. Because you have data only at certain instants, your graph should consist of dots that are not connected together.

