Consumer surplus is a key concept in economics that reflects the benefit consumers receive when they pay less for a product than what they are willing to pay. This idea is closely tied to the concept of willingness to pay, which is the maximum price a consumer is prepared to pay for a good or service. In economic terms, this is often referred to as the reservation price.
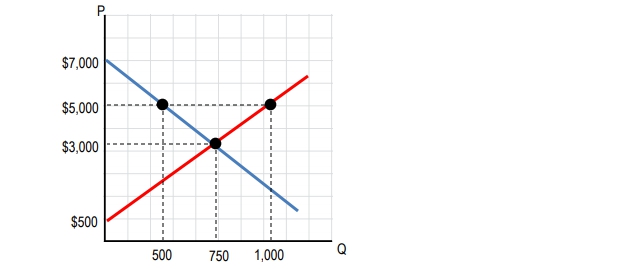
The demand curve visually represents consumers' willingness to pay at various price levels. When the market price is lower than what a consumer is willing to pay, a consumer surplus occurs. For instance, if a consumer is willing to pay \$20 for a product but only pays \$12, the consumer surplus is \$8, which is the difference between the willingness to pay and the market price.
To quantify consumer surplus, the formula is straightforward:
\[ \text{Consumer Surplus} = \text{Willingness to Pay} - \text{Market Price} \]
This surplus can also be understood through the lens of marginal benefit, which refers to the additional satisfaction or utility gained from consuming one more unit of a good. The demand curve reflects the marginal benefit to consumers, indicating how much value they place on each additional unit of a product.
Consider a simplified market scenario with four consumers: Cartman, Kyle, Stan, and Kenny, each with different willingness to pay for a product, such as a golden cheesy poof. Cartman is willing to pay \$8, Kyle \$6, Stan \$4, and Kenny \$2. If the market price is set at \$7, only Cartman will purchase the product, resulting in a consumer surplus of \$1 for him, calculated as follows:
\[ \text{Consumer Surplus} = 8 - 7 = 1 \]
As the price decreases to \$5, both Cartman and Kyle will buy the product. Cartman's consumer surplus increases to \$3, while Kyle's surplus is \$1, leading to a total consumer surplus of \$4:
\[ \text{Total Consumer Surplus} = 3 + 1 = 4 \]
When the price drops further to \$4, Cartman’s surplus grows to \$4, Kyle’s to \$2, and Stan enters the market with no surplus since he pays exactly what he is willing to pay. The total consumer surplus now reaches \$6:
\[ \text{Total Consumer Surplus} = 4 + 2 + 0 = 6 \]
This example illustrates how consumer surplus increases as market prices decrease, allowing more consumers to benefit from lower prices. The graphical representation of consumer surplus can be visualized as the area above the market price and below the demand curve, highlighting the economic benefit consumers receive from favorable pricing.