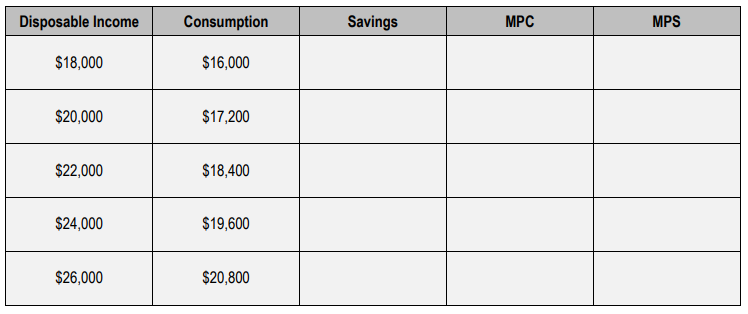
The consumption function is a crucial concept in understanding household spending, which is a significant component of Gross Domestic Product (GDP). It represents the relationship between disposable income and consumption, where disposable income is the amount of money households have left after paying taxes. This leftover income can either be spent on consumption or saved. The consumption function, sometimes referred to as the consumption schedule, illustrates how changes in disposable income affect consumption levels.
When households experience an increase in disposable income, such as receiving a bonus or a raise, they are likely to increase their consumption. For instance, if an individual receives a \$10,000 bonus and a 20% raise, they will have more disposable income, leading to higher consumption levels. However, it is important to note that not all additional income will be spent; some will likely be saved as well.
Graphically, the consumption function can be represented alongside a 45-degree line, which indicates that every dollar of disposable income is used for consumption. This line serves as a reference point. For example, if a household has \$1,000 in disposable income, the 45-degree line suggests that they would consume \$1,000. However, the actual consumption function typically lies above this line, indicating that households may not consume all of their disposable income.
At the point where the consumption function intersects the 45-degree line, all disposable income is consumed. Conversely, if the consumption function is above the 45-degree line, it indicates that households are saving some of their disposable income. The difference between the consumption function and the 45-degree line represents savings. For example, if a household has \$4,000 in disposable income but consumes only \$3,500, the \$500 difference is their savings.
Additionally, there are scenarios where households may consume more than their disposable income, leading to a situation known as dis-saving. This occurs when individuals draw from their savings or incur debt to maintain their consumption levels. For instance, if a household with \$1,000 in disposable income consumes \$1,200, they are engaging in dis-saving, which means they are spending beyond their means.
Understanding the consumption function is essential for analyzing economic behavior, as it helps gauge how changes in income influence spending and saving patterns. The concept of marginal propensity to consume (MPC) will further elaborate on how much of each additional dollar of income is spent on consumption, providing deeper insights into consumer behavior.