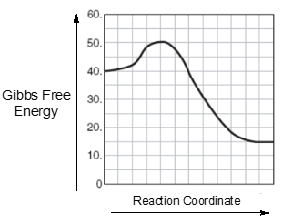
An energy diagram is a graphical representation that illustrates the energies of reactants, products, and the transition state throughout a chemical reaction. In this diagram, the reactants, denoted as r, are positioned on the left side, while the products, represented by p, are found on the right side at the end of the curve. The transition state, abbreviated as ts, corresponds to the peak of the curve and signifies the maximum energy structure along the reaction coordinate, which is the pathway from reactants to products. This transition state is also known as the activated complex.
The reaction coordinate, depicted along the x-axis, indicates the progress of the reaction, while the y-axis represents the change in energy, ranging from 80 kilojoules to 200 kilojoules. The activation energy, or energy barrier, abbreviated as E_a, is the minimum energy required for the reaction to proceed. It is defined as the height difference between the reactants and the transition state. Understanding these components is crucial, as they form the foundation of any energy diagram encountered in the study of chemical reactions.