Ch.10 - Chemical Bonding I: The Lewis Model
Chapter 10, Problem 61

Refer to Figure 10.10 to estimate the percent ionic character of the Hbr bond.
Graph showing percent ionic character vs. electronegativity difference for various compounds, including HBr.

Verified step by step guidance
1
Identify the HBr compound on the graph.
Observe the position of HBr on the graph, noting its coordinates in terms of percent ionic character and electronegativity difference.
Estimate the percent ionic character of HBr by looking at its position on the y-axis.
Estimate the electronegativity difference of HBr by looking at its position on the x-axis.
Use the graph to determine the approximate percent ionic character of the HBr bond based on its position relative to other compounds.

Verified video answer for a similar problem:

This video solution was recommended by our tutors as helpful for the problem above.
Video duration:
2m
Was this helpful?

Key Concepts

Here are the essential concepts you must grasp in order to answer the question correctly.

Ionic Character

Ionic character refers to the degree to which a bond between two atoms exhibits ionic properties, as opposed to covalent properties. It is influenced by the difference in electronegativity between the two atoms involved in the bond. A higher ionic character indicates a greater transfer of electrons from one atom to another, resulting in the formation of charged ions.
Recommended video:
Guided course
00:56
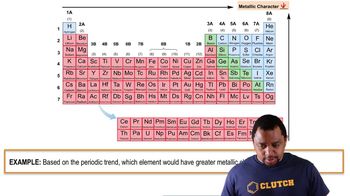
Metallic Character Example

Electronegativity Difference

Electronegativity is a measure of an atom's ability to attract and hold onto electrons in a chemical bond. The electronegativity difference between two bonded atoms can help predict the bond type: a small difference typically indicates a covalent bond, while a large difference suggests an ionic bond. The graph in the question illustrates how this difference correlates with the percent ionic character of various compounds.
Recommended video:
Guided course
02:10
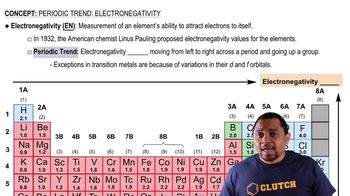
Electronegativity Trends

Percent Ionic Character Graph

The percent ionic character graph plots the electronegativity difference against the percent ionic character for various compounds. This visual representation allows for the estimation of ionic character based on electronegativity differences. By analyzing the position of HBr on this graph, one can estimate its ionic character relative to other compounds, providing insight into the nature of the H-Br bond.
Recommended video:
Guided course
00:56
Metallic Character Example