Determine whether or not each element is a transition element. a. Cr b. Br c. Mo d. Cs
Ch.2 - Atoms & Elements
Chapter 2, Problem 79
How would you sketch the mass spectrum of gallium given its two naturally occurring isotopes with the following masses and natural abundances: Isotope Mass (amu) Abundance (%) Ga-69 68.92558 60.108 Ga-71 70.92470 39.892?
 Verified step by step guidance
1
Determine the relative abundance of each isotope by converting the percentage to a decimal. For Ga-69, it is 0.60108 and for Ga-71, it is 0.39892.
Consider the x-axis of the mass spectrum, which represents the mass-to-charge ratio (m/z). Since the charge is typically +1 for singly charged ions, the m/z values will be approximately equal to the isotopic masses: 68.92558 for Ga-69 and 70.92470 for Ga-71.
The y-axis of the mass spectrum represents the relative intensity, which is proportional to the abundance of each isotope.
Plot the first peak at m/z = 68.92558 with a relative intensity corresponding to the abundance of Ga-69 (60.108%).
Plot the second peak at m/z = 70.92470 with a relative intensity corresponding to the abundance of Ga-71 (39.892%).
Key Concepts
Here are the essential concepts you must grasp in order to answer the question correctly.
Isotopes
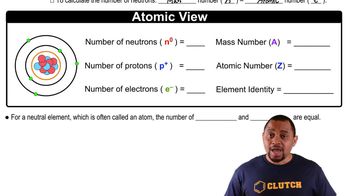
Isotopes are variants of a chemical element that have the same number of protons but different numbers of neutrons, resulting in different atomic masses. For gallium, the two isotopes, Ga-69 and Ga-71, have distinct masses and natural abundances, which are crucial for understanding how they contribute to the overall mass spectrum.
Recommended video:
Guided course

Isotopes
Mass Spectrum
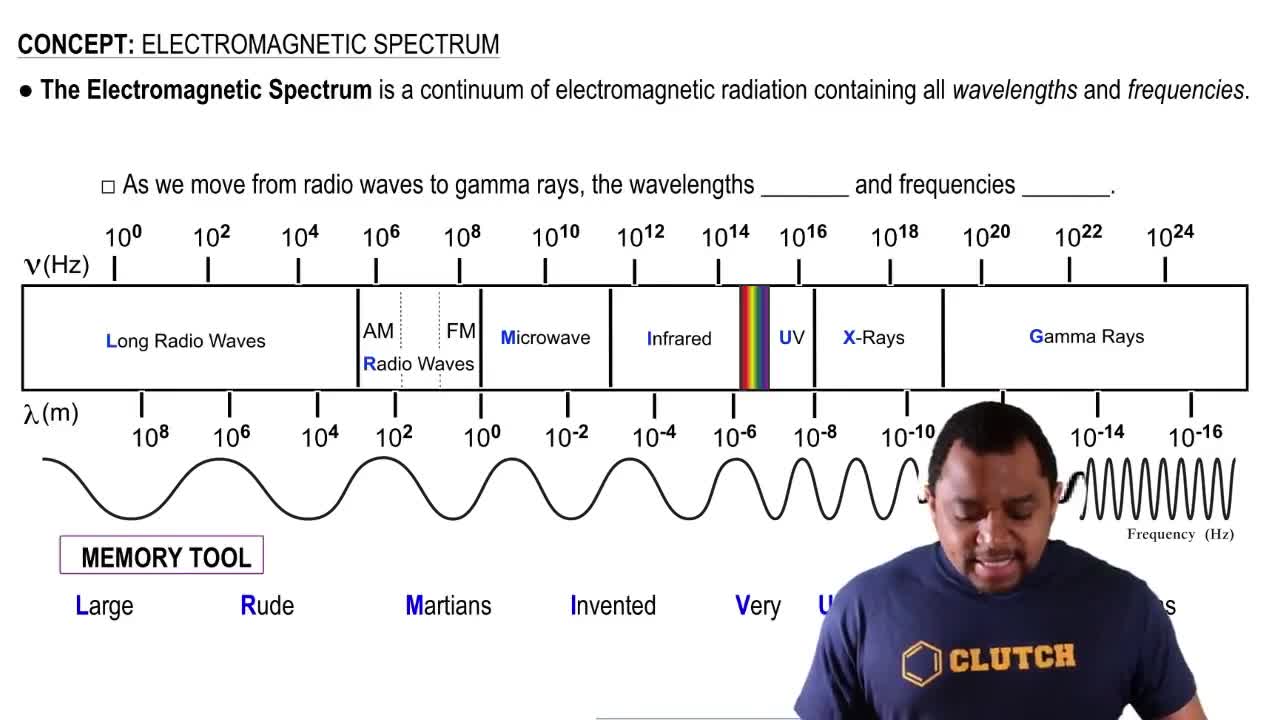
A mass spectrum is a graphical representation of the mass-to-charge ratio of ions. It displays the relative abundance of each isotope, allowing for the identification of isotopes present in a sample. The x-axis typically represents the mass-to-charge ratio (m/z), while the y-axis shows the intensity or abundance of each ion detected.
Recommended video:
Guided course

Electromagnetic Spectrum
Relative Abundance
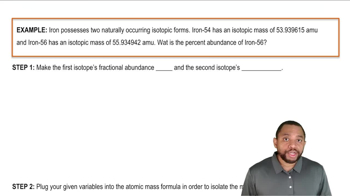
Relative abundance refers to the percentage of each isotope present in a naturally occurring sample of an element. In the case of gallium, the relative abundances of Ga-69 and Ga-71 are 60.108% and 39.892%, respectively. This information is essential for calculating the weighted average mass of gallium and accurately sketching its mass spectrum.
Recommended video:
Guided course

Calculating Abundance Example
Related Practice
Textbook Question
1
views
Textbook Question
Classify each element as an alkali metal, alkaline earth metal, halogen, or noble gas. a. F b. Sr c. K d. Ne e. At
2
views
Textbook Question
Which pair of elements do you expect to be most similar? Why? a. nitrogen and oxygen b. titanium and gallium c. lithium and sodium d. germanium and arsenic e. argon and bromine
1
views
Textbook Question
The atomic mass of fluorine is 18.998 amu, and its mass spectrum shows a large peak at this mass. The atomic mass of chlorine is 35.45 amu, yet the mass spectrum of chlorine does not show a peak at this mass. Explain the difference.
Textbook Question
An element has two naturally occurring isotopes. Isotope 1 has a mass of 120.9038 amu and a relative abundance of 57.4%, and isotope 2 has a mass of 122.9042 amu. Find the atomic mass of this element and identify it.
3
views
