Textbook Question
The diagram shows the energy of a reaction as the reaction progresses. Label each blank box in the diagram.
a. reactants b. products c. activation energy (Ea) d. enthalpy of reaction (ΔHrxn)

 Verified step by step guidance
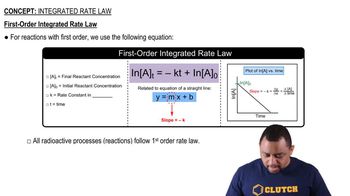
 02:29
02:29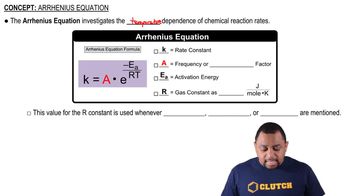 01:20
01:20 02:02
02:02The diagram shows the energy of a reaction as the reaction progresses. Label each blank box in the diagram.
a. reactants b. products c. activation energy (Ea) d. enthalpy of reaction (ΔHrxn)
The activation energy of a reaction is 44.2 kJ/mol and the frequency factor is 1.9⨉1011/ s. Calculate the rate constant of the reaction at 25 °C.
The rate constant (k) for a reaction was measured as a function of temperature. A plot of ln k versus 1/T (in K) is linear and has a slope of -7012 K. Calculate the activation energy for the reaction.
The tabulated data show the rate constant of a reaction measured at several different temperatures. Use an Arrhenius plot to determine the activation barrier and frequency factor for the reaction.
Temperature (K) Rate Constant (1 , s)
300 0.0134
310 0.0407
320 0.114
330 0.303
340 0.757