Here are the essential concepts you must grasp in order to answer the question correctly.
Phase Diagrams
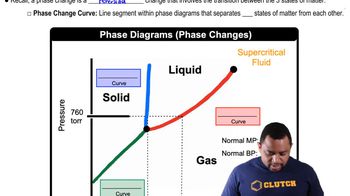
A phase diagram is a graphical representation that shows the states of a substance (solid, liquid, gas) at various temperatures and pressures. It typically includes lines that separate different phases, indicating conditions under which a substance will change from one phase to another. Understanding phase diagrams is crucial for determining boiling and melting points, as well as predicting the state of a substance under specific conditions.
Recommended video:
Phase Changes in Diagrams
Normal Boiling Point
The normal boiling point of a substance is the temperature at which it transitions from a liquid to a gas at a pressure of 1 atmosphere (atm). This point is significant because it reflects the energy required for the molecules to overcome intermolecular forces and enter the gaseous state. For iodine, identifying the normal boiling point involves locating the corresponding temperature on the phase diagram at 1 atm.
Recommended video:
Melting Point
The melting point is the temperature at which a solid becomes a liquid at a given pressure, typically 1 atm. This point is where the solid and liquid phases coexist in equilibrium. In the context of iodine, the melting point can be determined from the phase diagram by finding the temperature at which the solid phase transitions to the liquid phase at 1 atm pressure.
Recommended video:
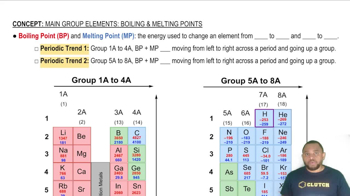
Boiling Point and Melting Point