The tabulated data show the concentration of AB versus time for this reaction: AB( g)¡A( g) + B( g) Time (s) [AB] (M) 0 0.950 50 0.459 100 0.302 150 0.225 200 0.180 250 0.149 300 0.128 350 0.112 400 0.0994 450 0.0894 500 0.0812 Determine the order of the reaction and the value of the rate constant. Predict the concentration of AB at 25 s.

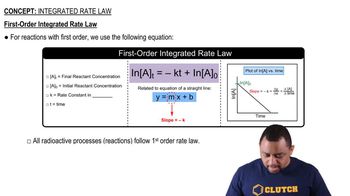
This reaction was monitored as a function of time: A → B + C A plot of ln[A] versus time yields a straight line with slope -0.0045/s. a. What is the value of the rate constant (k) for this reaction at this temperature?
 Verified step by step guidance
Verified video answer for a similar problem:
Key Concepts
First-Order Reactions

Rate Constant (k)

Graphical Analysis of Reaction Kinetics

The reaction A¡products was monitored as a function of time. The results are shown here. Time (s) [A] (M) 0 1.000 25 0.914 50 0.829 75 0.744 100 0.659 125 0.573 150 0.488 175 0.403 200 0.318 Determine the order of the reaction and the value of the rate constant. What is the rate of reaction when [A] = 0.10 M?
This reaction was monitored as a function of time: A → B + C A plot of ln[A] versus time yields a straight line with slope -0.0045/s. b. Write the rate law for the reaction.
This reaction was monitored as a function of time: A → B + C A plot of ln[A] versus time yields a straight line with slope -0.0045/s. c. What is the half-life?
This reaction was monitored as a function of time: A → B + C A plot of ln[A] versus time yields a straight line with slope -0.0045/s. d. If the initial concentration of A is 0.250 M, what is the concentration after 225 s?
