Is the question about drawing a diagram that depicts the energy progression of an endothermic chemical reaction with an activation energy twice the value of the reaction's enthalpy change formulated correctly?
Verified step by step guidance
1
Understand the key terms: An endothermic reaction absorbs energy, meaning the products have higher energy than the reactants. Activation energy is the energy required to initiate the reaction.
Identify the energy levels: In an endothermic reaction, the energy level of the reactants is lower than that of the products. The difference in energy between the reactants and products is the enthalpy change (ΔH).
Determine the activation energy: Since the activation energy is twice the value of the reaction's enthalpy change, calculate it as 2 * ΔH.
Sketch the energy diagram: Start with the reactants at a lower energy level, draw a peak representing the activation energy, and end with the products at a higher energy level.
Label the diagram: Indicate the activation energy (Ea) from the reactants to the peak, and the enthalpy change (ΔH) from the reactants to the products.
Key Concepts
Here are the essential concepts you must grasp in order to answer the question correctly.
Endothermic Reactions
Endothermic reactions are chemical processes that absorb energy from their surroundings, typically in the form of heat. This results in a decrease in the temperature of the surroundings. The enthalpy change (ΔH) for these reactions is positive, indicating that the products have higher energy than the reactants.
Activation energy is the minimum energy required for a chemical reaction to occur. It represents the energy barrier that must be overcome for reactants to transform into products. In endothermic reactions, the activation energy can be significantly higher than the enthalpy change, as the system needs to absorb energy to initiate the reaction.
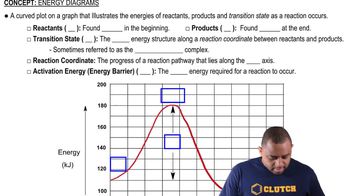
Energy diagrams visually represent the energy changes during a chemical reaction. They typically plot the energy of the system against the progress of the reaction. For endothermic reactions, the diagram shows a rise in energy as reactants are converted to products, with the activation energy depicted as a peak that must be surpassed for the reaction to proceed.
 Verified step by step guidance
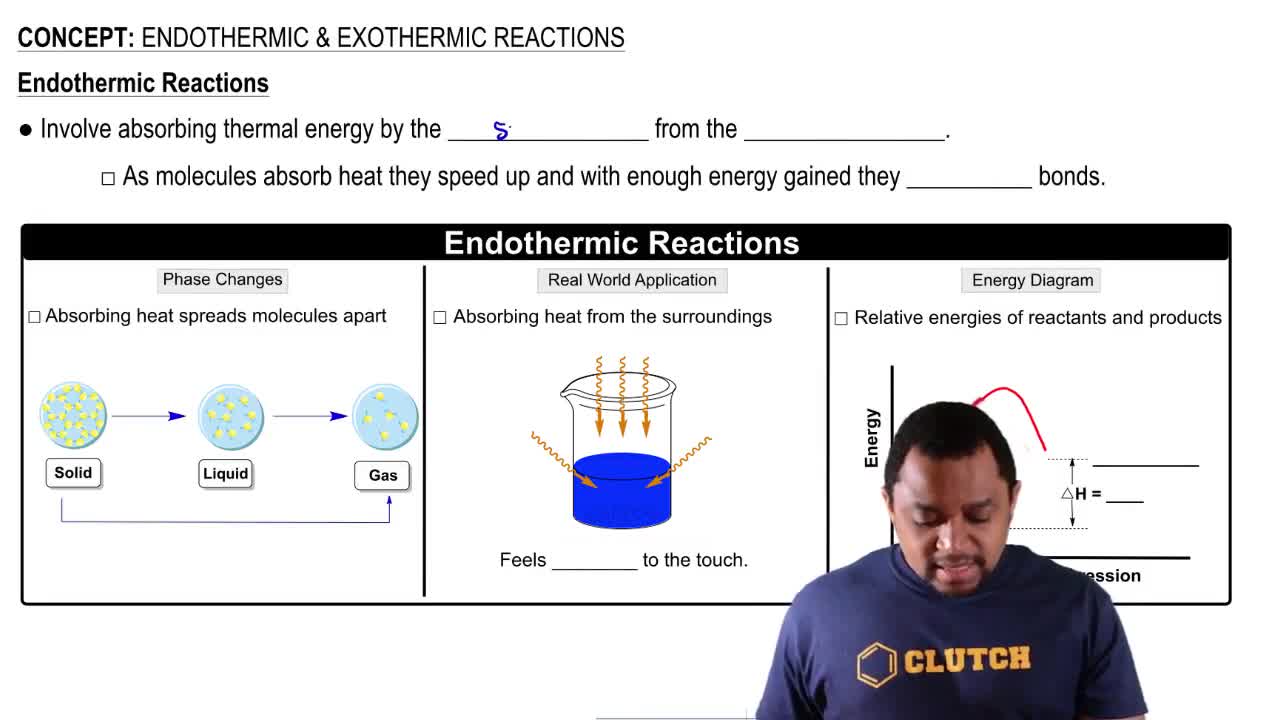
 02:30
02:30