You are high up in the mountains and boil water to make some tea. However, when you drink your tea, it is not as hot as it should be. You try again and again, but the water is just not hot enough to make a hot cup of tea. Which is the best explanation for this result? (a) High in the mountains, it is probably very dry, and so the water is rapidly evaporating from your cup and cooling it. (b) High in the mountains, it is probably very windy, and so the water is rapidly evaporating from your cup and cooling it. (c) High in the mountains, the air pressure is significantly less than 1 atm, so the boiling point of water is much lower than at sea level. (d) High in the mountains, the air pressure is significantly less than 1 atm, so the boiling point of water is much higher than at sea level.
- Ch.1 - Introduction: Matter, Energy, and Measurement146
- Ch.2 - Atoms, Molecules, and Ions200
- Ch.3 - Chemical Reactions and Reaction Stoichiometry176
- Ch.4 - Reactions in Aqueous Solution155
- Ch.5 - Thermochemistry126
- Ch.6 - Electronic Structure of Atoms131
- Ch.7 - Periodic Properties of the Elements126
- Ch.8 - Basic Concepts of Chemical Bonding123
- Ch.9 - Molecular Geometry and Bonding Theories143
- Ch.10 - Gases147
- Ch.11 - Liquids and Intermolecular Forces91
- Ch.12 - Solids and Modern Materials122
- Ch.13 - Properties of Solutions126
- Ch.14 - Chemical Kinetics174
- Ch.15 - Chemical Equilibrium101
- Ch.16 - Acid-Base Equilibria139
- Ch.17 - Additional Aspects of Aqueous Equilibria146
- Ch.18 - Chemistry of the Environment72
- Ch.19 - Chemical Thermodynamics129
- Ch.20 - Electrochemistry142
- Ch.21 - Nuclear Chemistry101
- Ch.22 - Chemistry of the Nonmetals68
- Ch.23 - Transition Metals and Coordination Chemistry66
- Ch.24 - The Chemistry of Life: Organic and Biological Chemistry10
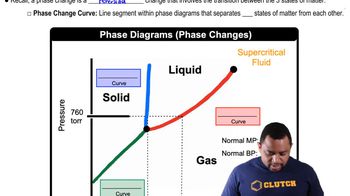
Referring to Figure 11.29, describe the phase changes (and the temperatures at which they occur) when CO2 is heated from -80 to -20°C at (a) a constant pressure of 3 atm,
 Verified step by step guidance
Verified video answer for a similar problem:
Key Concepts
Phase Changes
 01:46
01:46Phase Diagrams
 03:22
03:22Critical Point
 03:05
03:05Using the vapor-pressure curves in Figure 11.24, (d) estimate the external pressure at which diethyl ether will boil at 40 °C.
Appendix B lists the vapor pressure of water at various external pressures. (c) A city at an altitude of 5000 ft above sea level has a barometric pressure of 633 torr. To what temperature would you have to heat water to boil it in this city?
The phase diagram for neon is
Use the phase diagram to answer the following questions. (a) What is the approximate value of the normal melting point?
Use the phase diagram of neon to answer the following questions. (a) What is the approximate value of the normal boiling point?
Use the phase diagram of neon to answer the following questions. (b) What can you say about the strength of the intermolecular forces in neon and argon based on the critical points of Ne and Ar (see Table 11.5.)?