Under constant-volume conditions, the heat of combustion of naphthalene (C10H8) is 40.18 kJ/g. A 2.50-g sample of naphthalene is burned in a bomb calorimeter. The temperature of the calorimeter increases from 21.50 to 28.83 °C. (c) Suppose that in changing samples, a portion of the water in the calorimeter were lost. In what way, if any, would this change the heat capacity of the calorimeter?

Consider the following hypothetical reactions: A → B ΔHI = +60 kJ B → C ΔHII = -90 kJ (b) Construct an enthalpy diagram for substances A, B, and C, and show how Hess's law applies.
 Verified step by step guidance
Verified video answer for a similar problem:
Key Concepts
Enthalpy (ΔH)

Hess's Law

Enthalpy Diagram

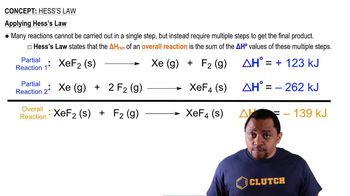
Consider the following hypothetical reactions: A → B ΔHI = +60 kJ B → C ΔHII = -90 kJ (a) Use Hess’s law to calculate the enthalpy change for the reaction A → C.
Calculate the enthalpy change for the reaction P4O6(s) + 2 O2(g) → P4O10(s) given the following enthalpies of reaction: P4(s) + 3 O2(g) → P4O6(s) ΔH = -1640.1 kJ P4(s) + 5 O2(g) → P4O10(s) ΔH = -2940.1 kJ
From the enthalpies of reaction 2 C(s) + O2(g) → 2 CO(g) ΔH = -221.0 kJ 2 C(s) + O2(g) + 4 H2(g) → 2 CH3OH(g) ΔH = -402.4 kJ Calculate ΔH for the reaction CO(g) + 2 H2(g) → CH3OH(g)
From the enthalpies of reaction H2(g) + F2(g) → 2 HF(g) ΔH = -537 kJ C(s) + 2 F2(g) → CF4(g) ΔH = -680 kJ 2 C(s) + 2 H2(g) → C2H4(g) ΔH = +52.3 kJ Calculate H for the reaction of ethylene with F2: C2H4(g) + 6 F2(g) → 2 CF4(g) + 4 HF(g)
