The following diagram represents a buffer composed of equal concentrations of a weak acid, HA, and its conjugate base, A-. The heights of the columns are proportional to the concentrations of the components of the buffer. (a) Which of the three drawings, (1), (2), or (3), represents the buffer after the addition of a strong acid? [Section 17.2]

Consider a beaker containing a saturated solution of PbI2 in equilibrium with undissolved PbI2(s). Now solid KI is added to this solution. (a) Will the amount of solid PbI2 at the bottom of the beaker increase, decrease, or remain the same? (b) Will the concentration of Pb2+ ions in solution increase or decrease? (c) Will the concentration of I- ions in solution increase or decrease?
 Verified step by step guidance
Key Concepts
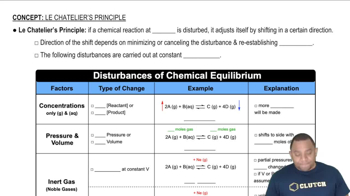
Le Chatelier's Principle

Solubility Product Constant (Ksp)

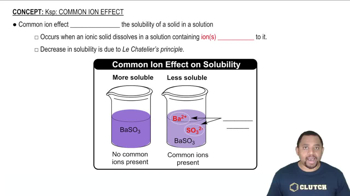
Common Ion Effect

The following diagram represents a buffer composed of equal concentrations of a weak acid, HA, and its conjugate base, A-. The heights of the columns are proportional to the concentrations of the components of the buffer. (c) Which of the three represents a situation that cannot arise from the addition of either an acid or a base? [Section 17.2]
The following figure represents solutions at various stages of the titration of a weak acid, HA, with NaOH. (The Na+ ions and water molecules have been omitted for clarity.) To which of the following regions of the titration curve does each drawing correspond: (b) after addition of NaOH but before the equivalence point? [Section 17.3]
Match the following descriptions of titration curves with the diagrams: (a) strong acid added to strong base. [Section 17.3]
Match the following descriptions of titration curves with the diagrams: (d) strong base added to polyprotic acid. [Section 17.3]
