Skip to main content
General Chemistry
My Course
Learn
Exam Prep
AI Tutor
Study Guides
Textbook Solutions
Flashcards
Explore
My Course
Learn
Exam Prep
AI Tutor
Study Guides
Textbook Solutions
Flashcards
Explore
Back
ICE Charts definitions
You can tap to flip the card.
ICE Chart
You can tap to
flip the card.
👆
ICE Chart
A table used to simplify calculations of equilibrium reactions by organizing data into Initial, Change, and Equilibrium stages.
Track progress
Control buttons has been changed to "navigation" mode.
1/11
Related practice
Recommended videos
Guided course
01:14
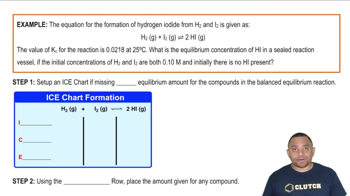
ICE Charts and Equilibrium Amount
Jules
Guided course
08:03
Calculate Equilibrium Amount with ICE Chart Example
Jules
Guided course
00:39
ICE Charts and Equilibrium Constant
Jules
Terms in this set (11)
Hide definitions
ICE Chart
A table used to simplify calculations of equilibrium reactions by organizing data into Initial, Change, and Equilibrium stages.
Equilibrium Reaction
A chemical reaction where the concentrations of reactants and products remain constant over time.
Equilibrium Amount
The concentration or pressure of a reactant or product in a chemical reaction at equilibrium.
Kp
The equilibrium constant for a reaction in terms of partial pressures of gases.
Kc
The equilibrium constant for a reaction in terms of molar concentrations of substances.
Molarity
A unit of concentration measuring the number of moles of a solute per liter of solution.
Atmospheres
A unit of pressure used in the context of gas-phase equilibrium reactions.
Equilibrium Constant
A ratio of product to reactant concentrations at equilibrium, denoted as K.
Balanced Chemical Reaction
A chemical equation with equal numbers of each type of atom on both sides of the equation.
Product
A substance formed as a result of a chemical reaction.
Reactant
A substance that undergoes change during a chemical reaction.
 BackBack
 01:14
01:14