Skip to main content
General Chemistry
My Course
Learn
Exam Prep
AI Tutor
Study Guides
Textbook Solutions
Flashcards
Explore
My Course
Learn
Exam Prep
AI Tutor
Study Guides
Textbook Solutions
Flashcards
Explore
Back
Energy Diagrams definitions
You can tap to flip the card.
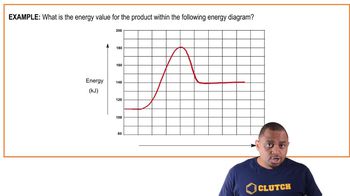
Energy Diagram
You can tap to
flip the card.
👆
Energy Diagram
A graph illustrating the energy changes of reactants, products, and transition state during a chemical reaction.
Track progress
Control buttons has been changed to "navigation" mode.
1/13
Related practice
Recommended videos
Guided course
01:57
Energy Diagrams
Jules
Guided course
01:02
Energy Diagram Example
Jules
Guided course
02:02
Speed of Reactions
Jules
Terms in this set (13)
Hide definitions
Energy Diagram
A graph illustrating the energy changes of reactants, products, and transition state during a chemical reaction.
Reactants
Substances present at the start of a chemical reaction, located on the left side of an energy diagram.
Products
Substances formed at the end of a chemical reaction, located on the right side of an energy diagram.
Transition State
The highest energy structure along the reaction coordinate, representing a peak in energy.
Activated Complex
Another term for the transition state, indicating the highest energy point in a reaction.
Reaction Coordinate
The progress of a reaction pathway, typically represented along the x-axis of an energy diagram.
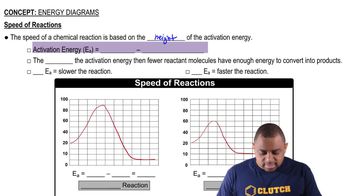
Activation Energy
The minimum energy required for a reaction to occur, measured from reactants to the transition state.
Energy Barrier
Another term for activation energy, representing the energy threshold that must be overcome.
Exothermic Process
A reaction where energy is released, resulting in products that are lower in energy than reactants.
Endothermic Process
A reaction where energy is absorbed, resulting in products that are higher in energy than reactants.
Stability
Determined by the overall energy change, with lower energy indicating greater stability in reactions.
ΔE
The overall energy change of a reaction, calculated as products minus reactants.
ΔH
The change in thermal energy of a reaction, interchangeable with ΔE in energy diagrams.
 BackBack
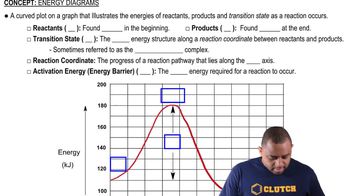
 01:57
01:57