The following diagrams represent mixtures of NO(g) and O21g2. These two substances react as follows: 2 NO1g2 + O21g2¡2 NO21g2 It has been determined experimentally that the rate is second order in NO and first order in O2. Based on this fact, which of the following mixtures will have the fastest initial rate? [Section 14.3]
Ch.14 - Chemical Kinetics

Brown14th EditionChemistry: The Central ScienceISBN: 9780134414232Not the one you use?Change textbook
Chapter 14, Problem 8a
Which of the following linear plots do you expect for a reaction A¡products if the kinetics are (a) zero order, [Section 14.4]
![Four graphs showing plots of 1/[X], ln[X], and [X] over time for different reaction orders.](https://lightcat-files.s3.amazonaws.com/problem_images/fe3831e00d552752-1666282854514.jpg)
 Verified step by step guidance
1
Identify the order of the reaction. For a zero-order reaction, the rate of reaction is independent of the concentration of the reactant.
Recall that for a zero-order reaction, the concentration of the reactant [A] decreases linearly over time.
Understand that the integrated rate law for a zero-order reaction is [A] = [A]_0 - kt, where [A]_0 is the initial concentration and k is the rate constant.
Recognize that a plot of [A] versus time will yield a straight line with a negative slope for a zero-order reaction.
Compare the given plots: Plot D shows [X] (which can be considered as [A]) versus time as a straight line, indicating a zero-order reaction.

Verified video answer for a similar problem:
This video solution was recommended by our tutors as helpful for the problem above.
Video duration:
1mWas this helpful?
Key Concepts
Here are the essential concepts you must grasp in order to answer the question correctly.
Zero-Order Kinetics
In zero-order kinetics, the rate of reaction is constant and independent of the concentration of the reactant. This means that the reaction proceeds at a steady rate until the reactant is depleted. The concentration of the reactant decreases linearly over time, leading to a plot of [A] versus time that is a straight line.
Recommended video:
Guided course

Zero-Order Reactions
Integrated Rate Laws
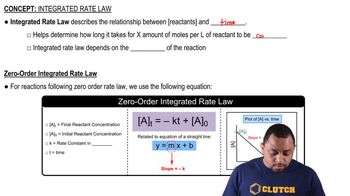
Integrated rate laws relate the concentration of reactants to time for different orders of reactions. For zero-order reactions, the integrated rate law is [A] = [A]₀ - kt, where [A]₀ is the initial concentration, k is the rate constant, and t is time. This equation indicates that a plot of [A] versus time will yield a straight line, confirming zero-order behavior.
Recommended video:
Guided course

Rate Law Fundamentals
Graphical Representation of Reaction Orders
Different reaction orders produce distinct graphical representations when plotting concentration versus time or its transformations. For zero-order reactions, a plot of [A] versus time is linear, while plots of 1/[A] or ln[A] versus time are not linear. Understanding these graphical representations is crucial for identifying the order of a reaction based on experimental data.
Recommended video:
Guided course

Zero-Order Reactions
Related Practice
Textbook Question
Textbook Question
Given the following diagrams at t = 0 min and t = 30 min
After four half-life periods for a first-order reaction, what fraction of reactant remains? [Section 14.4]
Textbook Question
The accompanying graph shows plots of ln k versus 1>T for two different reactions. The plots have been extrapolated to the y-intercepts. Which reaction (red or blue) has (a) the larger value for Ea,
Textbook Question
The accompanying graph shows plots of ln k versus 1>T for two different reactions. The plots have been extrapolated to the y-intercepts. Which reaction (red or blue) has (b) the larger value for the frequency factor, A? [Section 14.5]
2
views
