Ch.11 - Liquids & Phase Changes
Chapter 11, Problem 100

Draw a phase diagram showing how the phase boundaries differ for a pure solvent compared with a solution.Phase diagram comparing pure solvent and solution phases under varying pressure and temperature.
Phase diagram comparing pure solvent and solution phases under varying pressure and temperature.

Verified step by step guidance
1
Identify the phase boundaries for the pure solvent and the solution on the phase diagram.
Note that the phase boundaries for the solution are shifted compared to the pure solvent.
Observe that the freezing point of the solution is lower than that of the pure solvent, indicating freezing point depression.
Observe that the boiling point of the solution is higher than that of the pure solvent, indicating boiling point elevation.
Draw the phase diagram with the phase boundaries for the pure solvent and the solution, clearly labeling the solid, liquid, and gas regions for both.

Verified video answer for a similar problem:

This video solution was recommended by our tutors as helpful for the problem above.
Video duration:
2m
Was this helpful?

Key Concepts

Here are the essential concepts you must grasp in order to answer the question correctly.

Phase Diagram

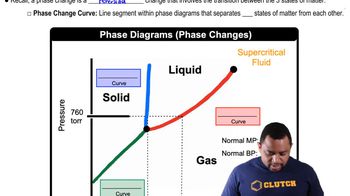
A phase diagram is a graphical representation that shows the phases of a substance as a function of temperature and pressure. It illustrates the boundaries between different phases (solid, liquid, gas) and indicates the conditions under which each phase is stable. Understanding phase diagrams is crucial for analyzing how substances behave under varying environmental conditions.
Recommended video:
Guided course
03:22
Phase Changes in Diagrams

Colligative Properties

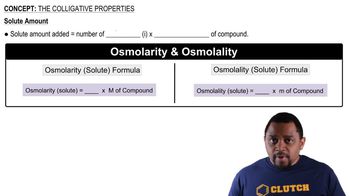
Colligative properties are properties of solutions that depend on the number of solute particles in a given amount of solvent, rather than the identity of the solute. These properties include boiling point elevation, freezing point depression, vapor pressure lowering, and osmotic pressure. They play a significant role in understanding how the addition of solute affects the phase behavior of a solvent.
Recommended video:
Guided course
01:26
Colligative Properties

Phase Boundaries

Phase boundaries are the lines on a phase diagram that separate different phases of a substance. They indicate the conditions (temperature and pressure) at which two phases can coexist in equilibrium. In the context of pure solvents and solutions, the phase boundaries differ due to the presence of solute, which alters the physical properties and stability of the phases.
Recommended video:
Guided course
03:22
Phase Changes in Diagrams
Related Practice