A gas is confined to a cylinder under constant atmospheric pressure, as illustrated in Figure 5.4. When 0.49 kJ of heat is added to the gas, it expands and does 214 J of work on the surroundings. What are the values of H and E for this process?
Ch.5 - Thermochemistry

Brown15th EditionChemistry: The Central ScienceISBN: 9780137542970Not the one you use?Change textbook
Chapter 5, Problem 39b
The complete combustion of ethanol, C2H5OH(l), to form H2O(g) and CO2(g) at constant pressure releases 1235 kJ of heat per mole of C2H5OH. b. Draw an enthalpy diagram for the reaction.
 Verified step by step guidance
1
Draw a horizontal line to represent the enthalpy level of the reactants, C_2H_5OH(l) and O_2(g).
Draw another horizontal line below the reactants' line to represent the enthalpy level of the products, H_2O(g) and CO_2(g).
Label the reactants' line with 'Reactants: C_2H_5OH(l) + O_2(g)' and the products' line with 'Products: H_2O(g) + CO_2(g)'.
Draw a vertical arrow pointing downward from the reactants' line to the products' line to indicate the release of energy.
Label the arrow with '-1235 kJ/mol' to indicate the exothermic nature of the reaction, as energy is released.

Verified video answer for a similar problem:
This video solution was recommended by our tutors as helpful for the problem above.
Video duration:
2mWas this helpful?
Key Concepts
Here are the essential concepts you must grasp in order to answer the question correctly.
Combustion Reaction
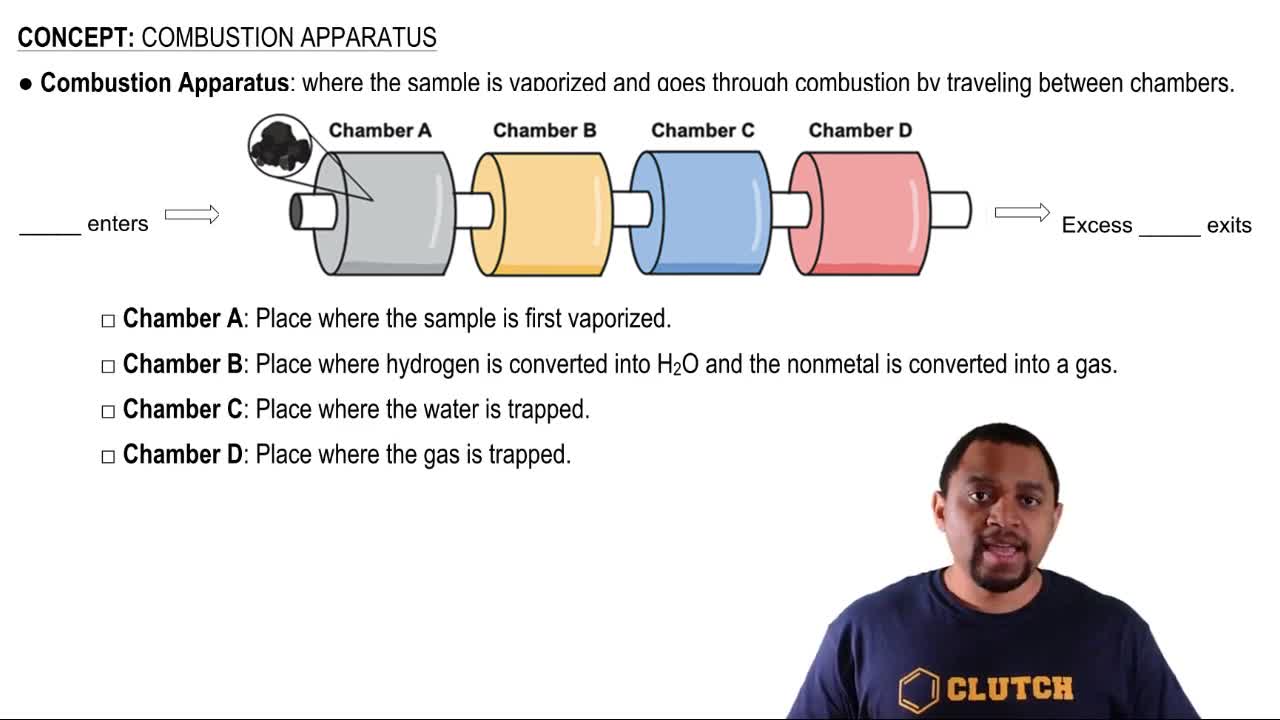
A combustion reaction is a chemical process in which a substance reacts rapidly with oxygen, producing heat and light. In the case of ethanol, C2H5OH, its combustion results in the formation of carbon dioxide (CO2) and water (H2O), releasing energy. Understanding this reaction is crucial for analyzing energy changes and the products formed during combustion.
Recommended video:
Guided course

Combustion Apparatus
Enthalpy Change
Enthalpy change (ΔH) refers to the heat content change of a system at constant pressure during a chemical reaction. For the combustion of ethanol, the enthalpy change is negative, indicating that the reaction is exothermic, as it releases 1235 kJ of heat per mole. This concept is essential for interpreting energy diagrams and understanding the thermodynamics of the reaction.
Recommended video:
Guided course

Enthalpy of Formation
Enthalpy Diagram
An enthalpy diagram visually represents the energy changes during a chemical reaction. It typically shows the enthalpy of reactants and products, along with the enthalpy change (ΔH). For the combustion of ethanol, the diagram would illustrate the decrease in enthalpy as the reactants convert to products, highlighting the energy released in the process.
Recommended video:
Guided course

Enthalpy of Formation
Related Practice
Textbook Question
1
views
Textbook Question
The decomposition of Ca(OH)2 into CaO(s) and H2O at constant pressure requires the addition of 109 kJ of heat per mole of Ca(OH)2 . b. Draw an enthalpy diagram for the reaction.
Textbook Question
Ozone, O3(g), is a form of elemental oxygen that plays an important role in the absorption of ultraviolet radiation in the stratosphere. It decomposes to O2(g) at room temperature and pressure according to the following reaction: 2 O3(g) → 3 O2(g) ΔH= -284.6 kJ b. Which has the higher enthalpy under these conditions, 2 O3(g) or 3 O2(g)?
Textbook Question
Without referring to tables, predict which of the following has the higher enthalpy in each case: (a) 1 mol CO2(s) or 1 mol CO2(g) at the same temperature
