Textbook Question
(a) Which is more likely to eventually be shown to be incorrect: an hypothesis or a theory?
27
views
 Verified step by step guidance
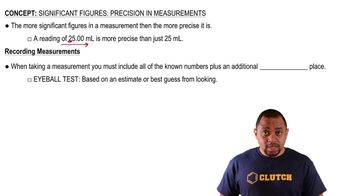
 01:49
01:49 02:42
02:42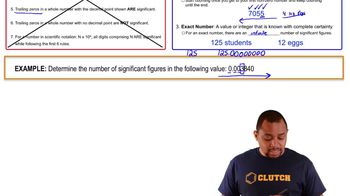 01:09
01:09(a) Which is more likely to eventually be shown to be incorrect: an hypothesis or a theory?
(b) A(n) _________ reliably predicts the behavior of matter, while a(n) _________ provides an explanation for that behavior.
A sample of ascorbic acid (vitamin C) is synthesized in the laboratory. It contains 1.50 g of carbon and 2.00 g of oxygen. Another sample of ascorbic acid isolated from citrus fruits contains 6.35 g of carbon. According to the law of constant composition, how many grams of oxygen does it contain?
Two students determine the percentage of lead in a sample as a laboratory exercise. The true percentage is 22.52%. The students' results for three determinations are as follows: (1) 22.52, 22.48, 22.54 (2) 22.64, 22.58, 22.62 (b) Precision can be judged by examining the average of the deviations from the average value for that data set. (Calculate the average value for each data set; then calculate the average value of the absolute deviations of each measurement from the average.) Which set is more precise?
What type of quantity (for example, length, volume, density) do the following units indicate? (a) m3 (b) ns (c) mm (d) g/dm3 (e) °C