Here are the essential concepts you must grasp in order to answer the question correctly.
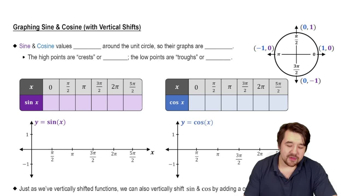
Function Graphing
Graphing a function involves plotting points on a coordinate system that represent the relationship between the input (x-values) and output (y-values) of the function. Understanding how to interpret the function's equation and identify key features such as intercepts, slopes, and asymptotes is essential for accurate graphing.
Recommended video:
Graph of Sine and Cosine Function
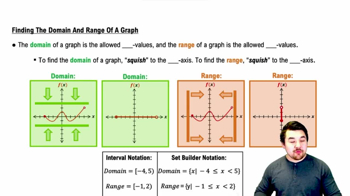
Domain and Range
The domain of a function is the set of all possible input values (x-values) that the function can accept, while the range is the set of all possible output values (y-values). Identifying the domain and range helps in understanding the behavior of the function and ensures that the graph accurately represents the function's limitations.
Recommended video:
Finding the Domain and Range of a Graph
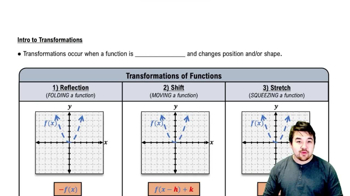
Transformations of Functions
Transformations involve shifting, stretching, compressing, or reflecting the graph of a function. Common transformations include vertical and horizontal shifts, which affect the position of the graph, and vertical stretches or compressions, which alter the steepness. Mastery of these concepts allows for the manipulation of basic function graphs to create more complex representations.
Recommended video: