Here are the essential concepts you must grasp in order to answer the question correctly.
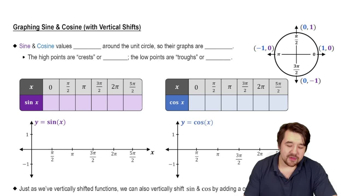
Graphing Functions
Graphing functions involves plotting the curve of a function on a coordinate plane to visualize its behavior. This includes identifying key features such as intercepts, where the graph crosses the axes, and understanding the overall shape and direction of the graph. Graphing utilities, like graphing calculators or software, can assist in accurately plotting complex functions.
Recommended video:
Graph of Sine and Cosine Function
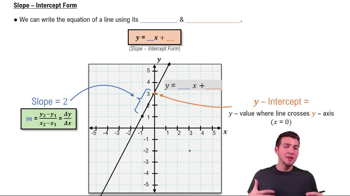
Intercepts
Intercepts are points where the graph of a function crosses the axes. The x-intercepts are found by setting the function equal to zero and solving for x, while the y-intercept is found by evaluating the function at x = 0. These points are crucial for understanding the function's behavior and are often used as starting points for sketching graphs.
Recommended video:
Local Extreme Values and Inflection Points
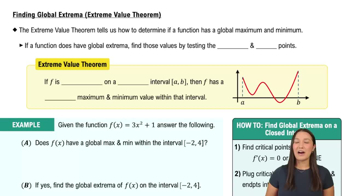
Local extreme values are points where a function reaches a local maximum or minimum. These can be found using the first derivative test. Inflection points occur where the function changes concavity, identified using the second derivative. Both concepts are essential for understanding the function's shape and behavior, especially when graphing.
Recommended video:
Finding Global Extrema (Extreme Value Theorem)