[Technology Exercise] Graph the functions in Exercises 63–66. Then find the extreme values of the function on the interval and say where they occur.
h(x) = |x + 2| − |x − 3|, −∞ < x < ∞
Verified step by step guidance
1
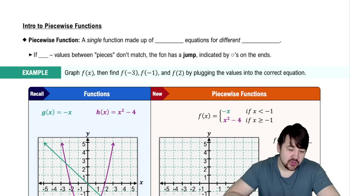
Step 1: Understand the function h(x) = |x + 2| − |x − 3|. This function involves absolute values, which can be split into piecewise functions based on the critical points where the expressions inside the absolute values change sign.
Step 2: Identify the critical points for the absolute value expressions. The critical points are x = -2 and x = 3, where the expressions inside the absolute values change sign.
Step 3: Break down the function into piecewise components based on the critical points. For x < -2, both expressions are negative, for -2 ≤ x < 3, the first expression is non-negative and the second is negative, and for x ≥ 3, both expressions are non-negative.
Step 4: Graph the piecewise function by evaluating h(x) in each interval: x < -2, -2 ≤ x < 3, and x ≥ 3. This will help visualize the behavior of the function across the entire domain.
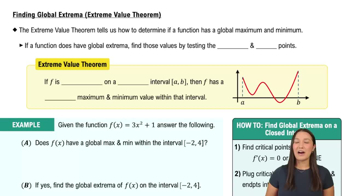
Step 5: Determine the extreme values by analyzing the graph and evaluating the function at the critical points and endpoints of the intervals. The extreme values occur where the function reaches its maximum or minimum values within the given domain.
Verified video answer for a similar problem:
This video solution was recommended by our tutors as helpful for the problem above
Video duration:
5m
Play a video:
0 Comments
Key Concepts
Here are the essential concepts you must grasp in order to answer the question correctly.
Absolute Value Functions
Absolute value functions, such as |x + 2| and |x - 3|, measure the distance of a number from zero on the number line, always yielding a non-negative result. These functions create V-shaped graphs and are crucial for understanding how the function h(x) = |x + 2| − |x − 3| behaves, especially at points where the expressions inside the absolute values change sign.
Graphing piecewise functions involves plotting different expressions over specified intervals. For h(x) = |x + 2| − |x − 3|, the function can be broken into segments based on the critical points where x + 2 = 0 and x - 3 = 0. Understanding how to graph these segments helps visualize the function's behavior and identify extreme values.
Extreme values of a function are its maximum and minimum values within a given interval. To find these for h(x), analyze the critical points where the derivative is zero or undefined, and evaluate the function at these points and endpoints of the interval. This process helps determine where the function reaches its highest or lowest values.

 Verified step by step guidance
 06:37
06:37