Here are the essential concepts you must grasp in order to answer the question correctly.
Asymptotes
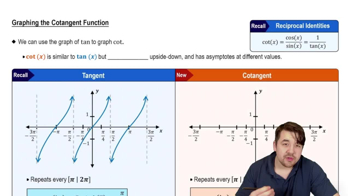
Asymptotes are lines that a graph approaches but never touches. They can be vertical, horizontal, or oblique. Vertical asymptotes occur where the function is undefined, typically at values that make the denominator zero. Horizontal asymptotes describe the behavior of a function as x approaches infinity, indicating the value the function approaches. Understanding asymptotes is crucial for accurately sketching the behavior of rational functions.
Recommended video:
Introduction to Cotangent Graph
Graphing Rational Functions
Graphing rational functions involves plotting the function defined as the ratio of two polynomials. Key steps include identifying intercepts, asymptotes, and the end behavior of the function. The degree of the numerator and denominator helps determine the horizontal asymptote, while factoring can reveal vertical asymptotes. A graphing utility can assist in visualizing these features, but manual sketching allows for correction of any inaccuracies.
Recommended video:
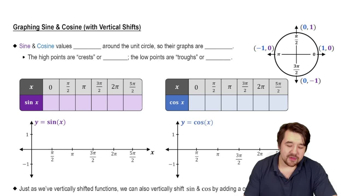
Graph of Sine and Cosine Function
End Behavior
End behavior refers to the behavior of a function as the input values approach positive or negative infinity. For rational functions, this is influenced by the degrees of the numerator and denominator. If the degree of the numerator is less than that of the denominator, the function approaches zero; if they are equal, it approaches the ratio of their leading coefficients. Understanding end behavior is essential for predicting how the graph behaves far from the origin.
Recommended video:
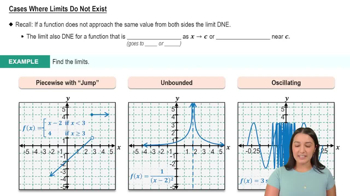
Cases Where Limits Do Not Exist