Step 1: Identify the given points on the graph. The function g passes through the points (2, 1) and (5, -1). Plot these points on the graph.
Step 2: Analyze the behavior of the function as x approaches 4. The limit \( \lim_{x \to 4} g(x) = -\infty \) indicates a vertical asymptote at \( x = 4 \). This means the graph will approach negative infinity as x gets closer to 4 from either side.
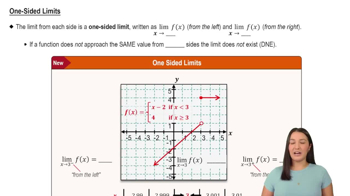
Step 3: Examine the behavior of the function as x approaches 7 from the left. The limit \( \lim_{x \to 7^-} g(x) = \infty \) suggests that as x approaches 7 from the left, the function g(x) goes to positive infinity, indicating a vertical asymptote at \( x = 7 \).
Step 4: Consider the behavior of the function as x approaches 7 from the right. The limit \( \lim_{x \to 7^+} g(x) = -\infty \) implies that as x approaches 7 from the right, the function g(x) goes to negative infinity, confirming the vertical asymptote at \( x = 7 \).
Step 5: Sketch the graph. Start by plotting the points (2, 1) and (5, -1). Draw the vertical asymptotes at x = 4 and x = 7. Ensure the graph approaches these asymptotes as described by the limits, and passes through the given points.
Verified video answer for a similar problem:
This video solution was recommended by our tutors as helpful for the problem above
Video duration:
8m
Play a video:
Was this helpful?
Key Concepts
Here are the essential concepts you must grasp in order to answer the question correctly.
Vertical Asymptotes
Vertical asymptotes occur in a graph when the function approaches infinity or negative infinity as the input approaches a certain value. This typically indicates that the function is undefined at that point, often due to division by zero. In the given question, the limits approaching x = 7 from the left and right suggest the presence of a vertical asymptote at x = 7.
Limits are fundamental in calculus, describing the behavior of a function as the input approaches a specific value. They help determine the function's value at points of discontinuity or where it may not be explicitly defined. The limits provided in the question indicate how the function behaves near x = 4 and x = 7, which are crucial for sketching the graph.
Function values at specific points provide critical information about the graph's behavior. In this case, g(2) = 1 and g(5) = -1 indicate the exact points on the graph where the function takes these values. Understanding these points helps in accurately plotting the function and ensuring it meets the specified conditions.