Here are the essential concepts you must grasp in order to answer the question correctly.
Graphing Trigonometric Functions
Graphing trigonometric functions involves understanding their periodic nature and key features such as amplitude, period, and phase shift. For the function y = cos(x) + √3 * sin(x), it is essential to recognize how the cosine and sine components combine to form a new wave, which can be graphed over the interval from 0 to 2π.
Recommended video:
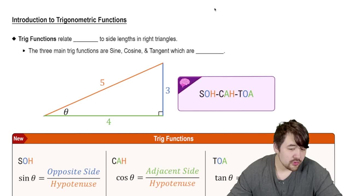
Introduction to Trigonometric Functions
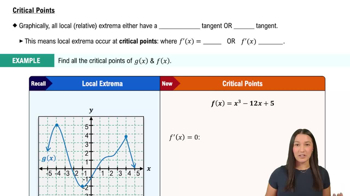
Local Extreme Points
Local extreme points are the points on a graph where the function reaches a local maximum or minimum. To find these points, one typically takes the derivative of the function, sets it to zero, and solves for x. The resulting x-values can then be evaluated in the original function to find the corresponding y-values.
Recommended video:
Inflection Points
Inflection points occur where the concavity of the function changes, which can be determined by analyzing the second derivative. If the second derivative changes sign at a point, that point is an inflection point. Identifying these points helps in understanding the overall shape of the graph and the behavior of the function.
Recommended video: