73–78. {Use of Tech} Normal lines A normal line at a point P on a curve passes through P and is perpendicular to the line tangent to the curve at P (see figure). Use the following equations and graphs to determine an equation of the normal line at the given point. Illustrate your work by graphing the curve with the normal line. <IMAGE>
Exercise 48
Verified step by step guidance
1
Identify the given curve equation and the specific point P where you need to find the normal line.
Calculate the derivative of the curve equation to find the slope of the tangent line at point P. This involves differentiating the function with respect to x.
Evaluate the derivative at the given point P to find the slope of the tangent line at that point.
Determine the slope of the normal line. Since the normal line is perpendicular to the tangent line, its slope is the negative reciprocal of the tangent line's slope.
Use the point-slope form of a line equation, y - y1 = m(x - x1), where m is the slope of the normal line and (x1, y1) is the point P, to write the equation of the normal line.
Verified video answer for a similar problem:
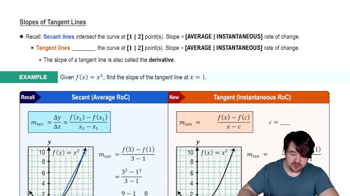
This video solution was recommended by our tutors as helpful for the problem above
Video duration:
6m
Play a video:
Was this helpful?
Key Concepts
Here are the essential concepts you must grasp in order to answer the question correctly.
Tangent Line
A tangent line to a curve at a given point is a straight line that touches the curve at that point without crossing it. The slope of the tangent line represents the instantaneous rate of change of the function at that point, which is determined by the derivative of the function. Understanding the tangent line is crucial for finding the normal line, as the normal line is defined in relation to the tangent.
A normal line at a point on a curve is a line that is perpendicular to the tangent line at that same point. Its slope is the negative reciprocal of the slope of the tangent line. To find the equation of the normal line, one must first calculate the slope of the tangent line and then use the point-slope form of a linear equation to derive the normal line's equation.
Graphing techniques involve plotting functions and their associated lines, such as tangent and normal lines, on a coordinate plane. This visual representation helps in understanding the behavior of the function at specific points. Utilizing graphing tools or software can enhance accuracy and provide a clearer illustration of the relationships between the curve, tangent, and normal lines.