Textbook Question
Use a graph of f to estimate or to show that the limit does not exist. Evaluate f(x) near to support your conjecture.
 Verified step by step guidanceVerified video answer for a similar problem:
 05:03
05:03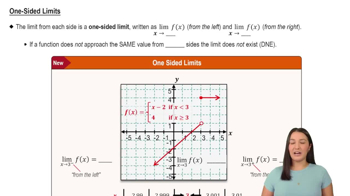 05:50
05:50 05:02
05:02 6:47m
6:47mMaster Finding Limits Numerically and Graphically with a bite sized video explanation from Patrick
Start learning