Graphing functions Use the guidelines of this section to make a complete graph of f.
f(x) = x⁴ + 4x³
Verified step by step guidance
1
Step 1: Identify the domain of the function f(x) = x⁴ + 4x³. Since this is a polynomial function, the domain is all real numbers.
Step 2: Find the critical points by taking the derivative of f(x). Compute f'(x) = \frac{d}{dx}(x⁴ + 4x³) using the power rule.
Step 3: Set the derivative f'(x) equal to zero to find the critical points. Solve the equation f'(x) = 0 for x.
Step 4: Determine the behavior of the function at the critical points by using the second derivative test. Compute f''(x) and evaluate it at the critical points to determine concavity.
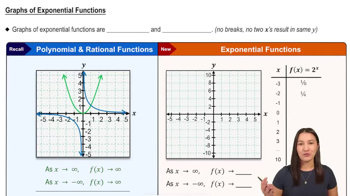
Step 5: Analyze the end behavior of the function by considering the leading term of f(x). As x approaches infinity or negative infinity, the term x⁴ dominates, indicating the function's behavior at the extremes.
Verified video answer for a similar problem:
This video solution was recommended by our tutors as helpful for the problem above
Video duration:
10m
Play a video:
Was this helpful?
Key Concepts
Here are the essential concepts you must grasp in order to answer the question correctly.
Polynomial Functions
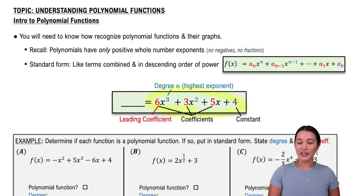
A polynomial function is a mathematical expression involving a sum of powers in one or more variables multiplied by coefficients. In this case, f(x) = x⁴ + 4x³ is a polynomial of degree 4, which indicates its highest exponent. Understanding the general shape and behavior of polynomial functions is crucial for graphing them effectively.
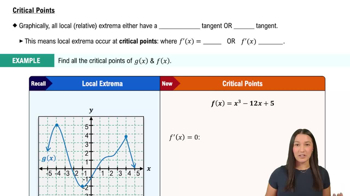
Critical points occur where the derivative of a function is zero or undefined, indicating potential local maxima, minima, or points of inflection. To find these points for f(x), we need to compute its derivative, f'(x), and solve for x. Analyzing these points helps in determining the overall shape and turning behavior of the graph.
End behavior describes how a function behaves as the input values approach positive or negative infinity. For polynomial functions, the leading term (the term with the highest degree) primarily dictates this behavior. In the case of f(x) = x⁴ + 4x³, as x approaches ±∞, the function will also approach ±∞, which is essential for sketching the graph accurately.