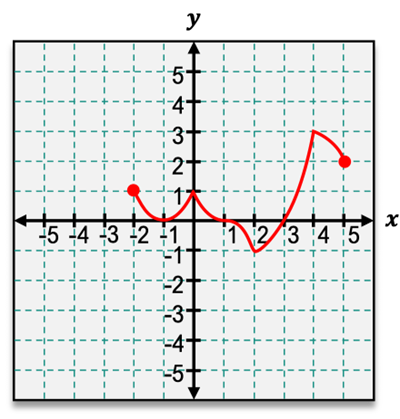
107. Marginal cost The accompanying graph shows the hypothetical cost c=f(x) of manufacturing x items. At approximately what production level does the marginal cost change from decreasing to increasing?
Table of contents
- 0. Functions7h 55m
- Introduction to Functions18m
- Piecewise Functions10m
- Properties of Functions9m
- Common Functions1h 8m
- Transformations5m
- Combining Functions27m
- Exponent rules32m
- Exponential Functions28m
- Logarithmic Functions24m
- Properties of Logarithms36m
- Exponential & Logarithmic Equations35m
- Introduction to Trigonometric Functions38m
- Graphs of Trigonometric Functions44m
- Trigonometric Identities47m
- Inverse Trigonometric Functions48m
- 1. Limits and Continuity2h 2m
- 2. Intro to Derivatives1h 33m
- 3. Techniques of Differentiation3h 18m
- 4. Applications of Derivatives2h 38m
- 5. Graphical Applications of Derivatives6h 2m
- 6. Derivatives of Inverse, Exponential, & Logarithmic Functions2h 37m
- 7. Antiderivatives & Indefinite Integrals1h 26m
- 8. Definite Integrals4h 44m
- 9. Graphical Applications of Integrals2h 27m
- 10. Physics Applications of Integrals 3h 16m
- 11. Integrals of Inverse, Exponential, & Logarithmic Functions2h 31m
- 12. Techniques of Integration7h 41m
- 13. Intro to Differential Equations2h 55m
- 14. Sequences & Series5h 36m
- 15. Power Series2h 19m
- 16. Parametric Equations & Polar Coordinates7h 58m
5. Graphical Applications of Derivatives
Concavity
Struggling with Calculus?
Join thousands of students who trust us to help them ace their exams!Watch the first videoMultiple Choice
For the following graph, find the open intervals for which the function is concave up or concave down. Identify any inflection points.

A
Concave up: (−2,−1), (2,4); Concave down: (−1,1), (1,2), (4,5); Inflection points: (−1,0), (1,0), (2,−1), (4,3)
B
Concave up: (−2,−1), (2,4); Concave down: (−1,2), (4,5); Inflection points: (0,1), (1,0), (2,−1), (4,3)
C
Concave up: (−2,1), (2,4); Concave down: (1,2), (4,5); Inflection points: (1,0), (2,−1), (4,3)
D
Concave up: (−2,0), (2,4); Concave down: (0,2), (4,5); Inflection points: (0,1), (1,0), (2,−1), (4,3)
0 Comments
 Verified step by step guidance
1
To determine where the function is concave up or down, we need to analyze the second derivative of the function. Concavity is determined by the sign of the second derivative: if it's positive, the function is concave up; if it's negative, the function is concave down.
Identify the points where the concavity changes, known as inflection points. These occur where the second derivative is zero or undefined, and the concavity changes from up to down or vice versa.
From the graph, observe the intervals where the curve is bending upwards (concave up) and downwards (concave down). Look for changes in the direction of bending to identify inflection points.
Based on the graph, the function appears to be concave up on the intervals (-2, 1) and (2, 4). This is where the curve is bending upwards.
The function is concave down on the intervals (1, 2) and (4, 5). Inflection points, where the concavity changes, are approximately at (1, 0), (2, -1), and (4, 3).

 6:38m
6:38mWatch next
Master Determining Concavity from the Graph of f with a bite sized video explanation from Patrick
Start learningRelated Videos
Related Practice
Textbook Question


